A Closer Look at Surfer’s Evolving 3D Modeling Capabilities
“Surfer is a much more powerful subsurface mapping package, providing users with more capabilities to analyze their 3D data sets and extract useful information. This functionality helps environmental engineers, hydrologists, geophysicists, and geologists to better understand the areas around their wells and drillholes.”
–Kari Dickenson, Surfer Product Manager
In the world of geospatial software, Surfer has continually established itself as a top choice for professionals in a wide variety of industries all across the globe. To serve these dynamic industries, Surfer continues to evolve, particularly in the realm of 3D modeling and analysis. Today marks a new release of Surfer which brings to life a comprehensive set of 3D functionality. The latest iteration of Surfer is designed to empower users to uncover deeper insights and spark ‘Aha!’ moments with compelling visualizations.
Complex Data Made Clear with 3D Modeling Enhancements
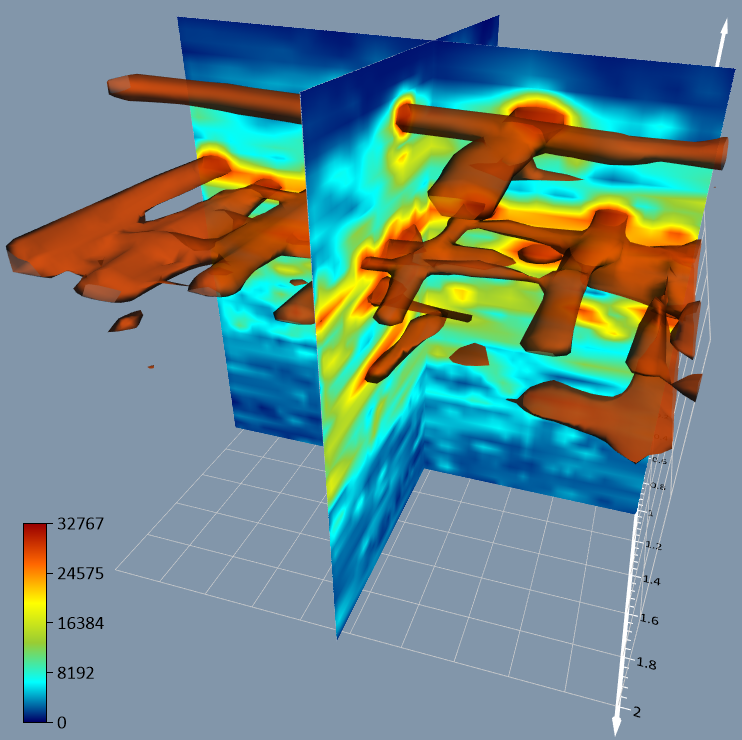
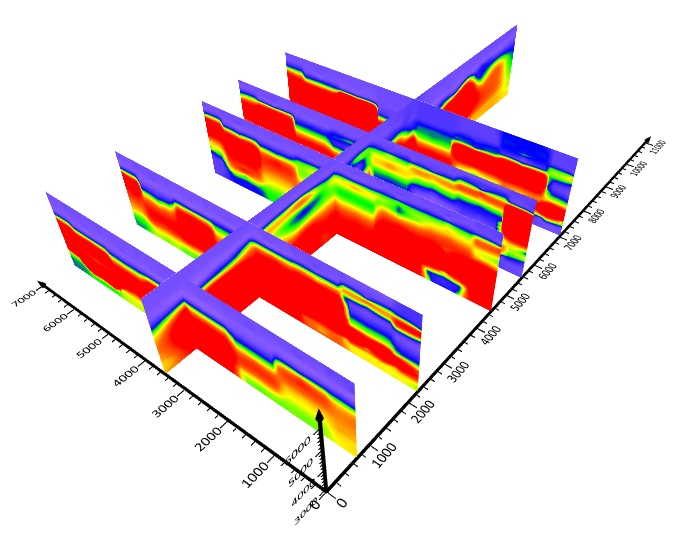
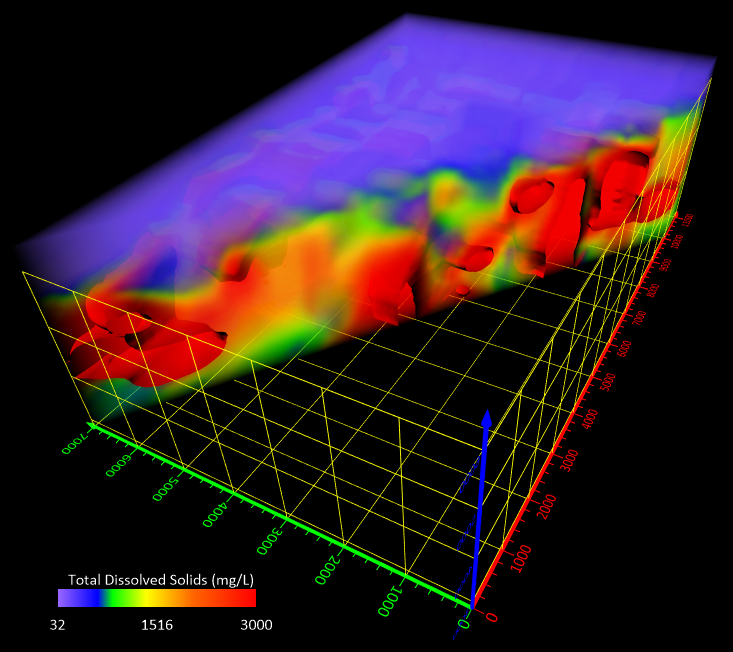
While 3D volumes offer a holistic view, they can sometimes be overwhelming or confusing to non-experts. By incorporating image slices and clipping planes, you can reduce this complexity to more easily communicate specific findings in a manner that’s easier for your stakeholders to grasp.
With an image slice, narrow your area of focus to specific intervals within the 3D volume. Slice 3D grids at any location, orientation, or angle. Add as many slices as desired and use the location slider to move through your 3D image to observe how the cross section changes along survey lines or at specific orientations.
Clipping planes help eliminate extraneous information and make it easier to study the area of interest. Apply a clipping plane based on the real world coordinate systems associated with your model. Custom clipping planes can be applied to each visualization associated with a 3D grid including 3D volumes, 2D slice layers, and isosurfaces.
Shedding Light on Subsurface Data
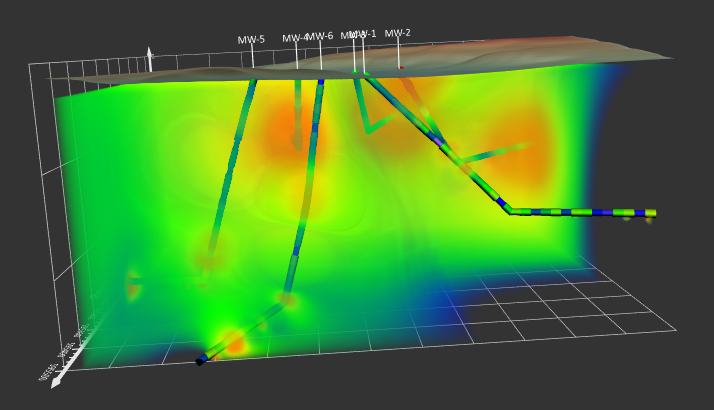
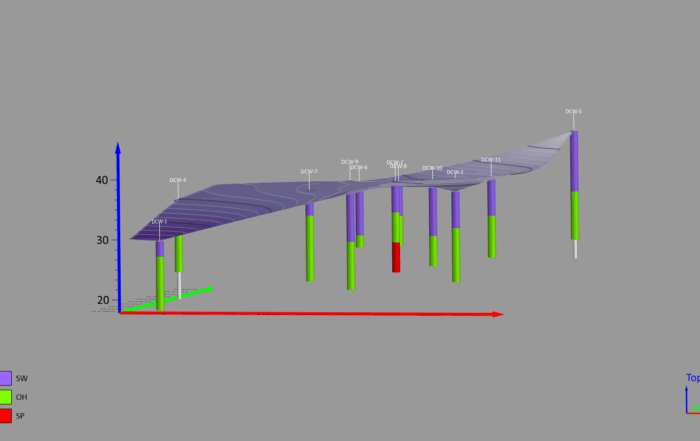
Drillholes serve as windows to the subsurface, providing invaluable data and insights, from resource extraction to environmental protection. This latest release of Surfer enhances the existing drillhole functionality.
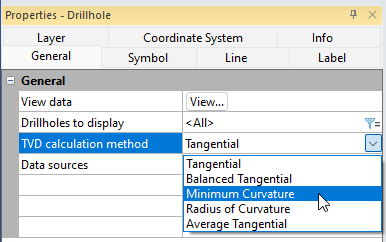
When working with deviated drillholes, accurate representation in three dimensions is critical. Calculate the true vertical depth along the hole by choosing one of five different calculation methods to generate the most accurate drillhole path. When you change calculation methods, immediately view the change in both the 2D plot view and 3D view for a quick accuracy check.
Another improved feature is Surfer’s Drillhole Manager. Now, the data you’ve meticulously collected and consolidated from numerous drillers can be saved to a single file for further analysis. For example, save a single table or multiple tables as an XLSX file and share with a coworker. Or, save your interval or point data to an XYZC data file to then interpolate and visualize in the 3D view as a fully rendered volume alongside the drillhole paths.
Effective Collaboration & Communication
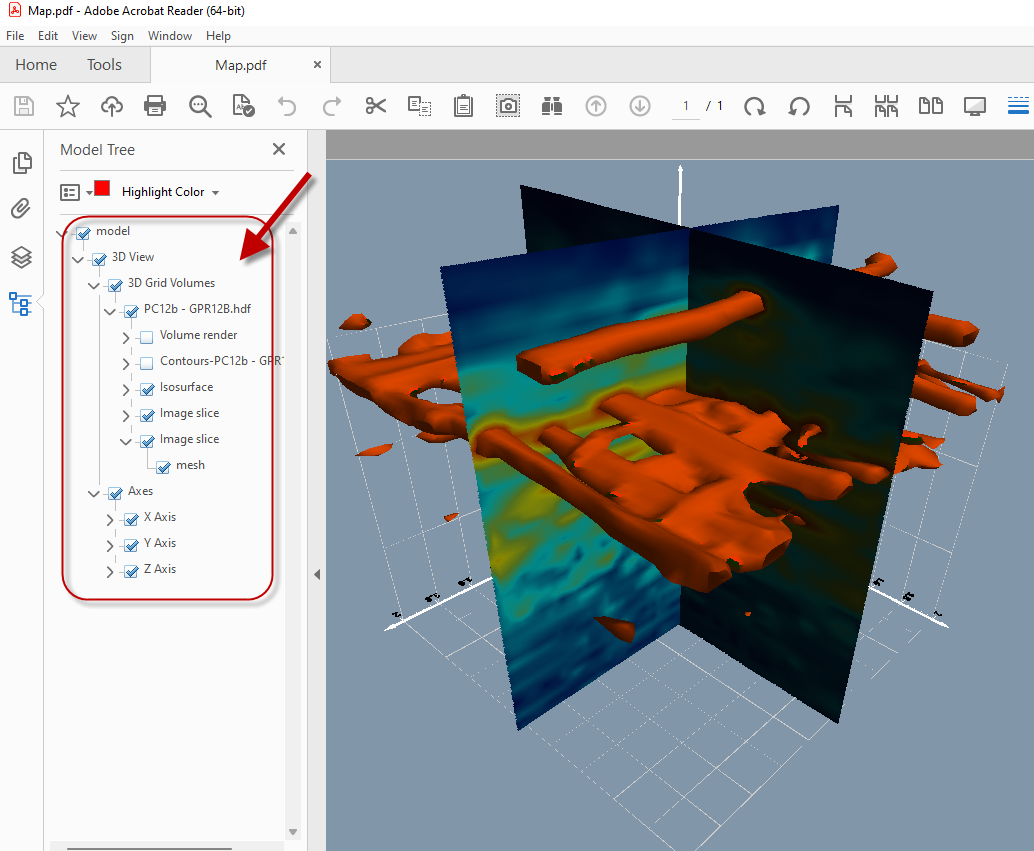
When it’s time to share your findings with others, Surfer’s enhanced 3D PDF and VRML export options help you effectively communicate and collaborate. In the latest release, every aspect of the 3D view is exported, including axes and grid lines. When exporting to a 3D PDF file, all objects in your 3D model are logically grouped together. Now clients and stakeholders can rotate, pan, and zoom into the 3D model directly, toggle layers on and off to foster a deeper understanding and have a more immersive experience with your work.
With the latest release of Surfer, more tools are at your disposal to overcome the challenge of communicating your insights to both technical and non-technical people alike. Dive into this new era of 3D modeling with Surfer and redefine what’s possible!
