Environmental Site Characterization in Surfer
Dickson & Associates is known for their expertise in forensic analysis of complex environmental data. In the webinar Environmental Insights: An Expert’s Approach to Site Characterization with Surfer, Zach Dickson, president and principal hydrogeologist, graciously shared some of his expertise with us. In the webinar, he demonstrated how he uses Surfer to model site characterization and groundwater impacts from TCE as part of a forensic site analysis.
Understanding the site
The site in question is an industrial park near the local airport. There are also nearby residential neighborhoods and firefighting test sites. The entire area is located in the San Luis Obispo Valley Groundwater Basin in southern California. This basin is essentially a bathtub basin underlain by impermeable sediments of the Franciscan formation and infilled with semi-permeable sediments that contain the groundwater. Outside of a few perch and deep groundwater zones, the basin flows as one groundwater horizon in a westerly direction.
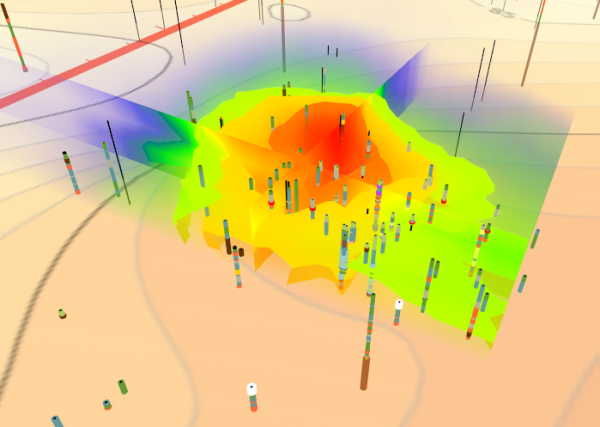
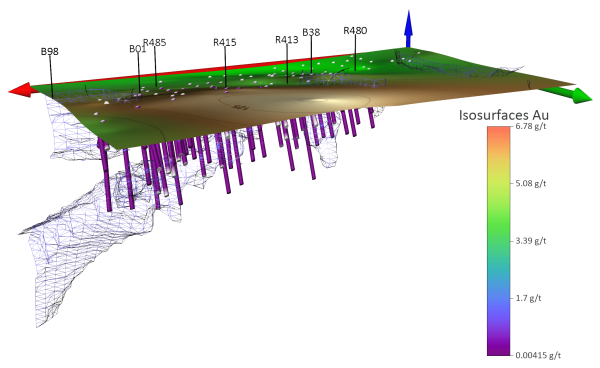
3D View of water basin below site investigation in Surfer
Analyzing the data
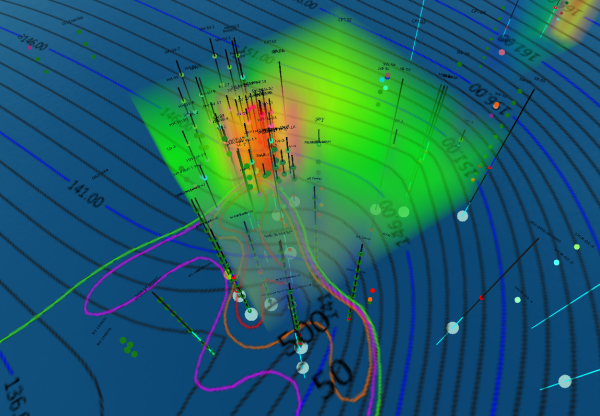
Dickson & Associates was hired by a client that had received a clean-up and abatement order for trichloroethylene (TCE) from the local water board. The water board used local air vapor and groundwater survey data to generate a model that showed a TCE plume with a bullseye under the client’s building and with groundwater flows to the west.They concluded that the location of the bullseye indicated the source of the TCE contamination.
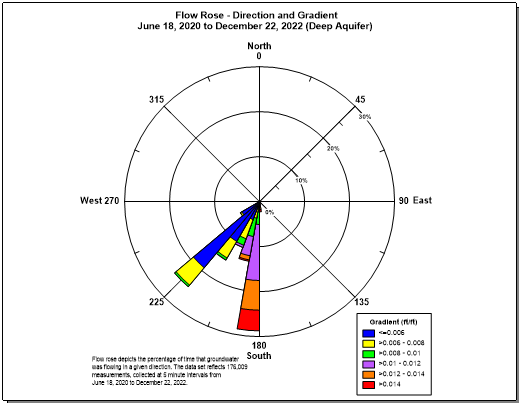
This proved to be an incorrect assumption in a high water use area like the one in question. In this site, there were bi-modal flows to southwest and south as a result of heavy pumping rather than to the west as seen in the basin as a whole.
Zach’s team worked with their client and impacted water users to collect data over a period of years to generate their final model. Data from residential monitoring systems and monitoring well data loggers was combined with several sources of historical data to gain a comprehensive understanding of the plume which cleared their client of any culpability.
Create your own site characterization model
Interested in creating a similar project in Surfer? Check out the resources below to learn more about the features and functionality used to create this model.
- Create a Drillhole Map in Surfer
- 3D Gridding in Surfer
- Surfer Help: Assign NoData to 2D & 3D grids
- The Nuts and Bolts of Surfer’s 3D View
- Grapher Help: Polar Rose Chart
If you have any specific questions, please reach out to our dedicated support team for more information.
