Key Takeaways from Storytelling with Data (Pt 2): How to Pick the Right Type of Data Visualization
When it comes to visualizing data, you’ve got a lot of options—bar charts, scatter plots, line graphs, slopegraphs, and more. But here’s the thing: not all visualizations are created equal. Each has a specific purpose, and choosing the right one can make or break your ability to communicate effectively with stakeholders. Pick the wrong visualization, and your story might be unclear or misunderstood. Pick the right one, and your insights will shine, leaving a lasting impression.
So, how do you make that choice? How do you ensure the data visualization you select perfectly aligns with the insights you’re sharing? In this next part of our Key Takeaways from Storytelling with Data series, we’ll guide you through the decision-making process to ensure you’re confident in choosing the best visual for your story.
Choosing the Right Visualization: A Guide to Key Graph Types
With so many types of data visualizations available, it’s important to understand the unique purpose each one serves. Selecting the right chart or graph isn’t just about aesthetics; it’s about ensuring that your data’s story is presented in the clearest and most compelling way possible. Below, we’ll walk through key data visualizations mentioned in Storytelling with Data, explaining what they are, when to use them, and how to use them effectively so you make the right choice.
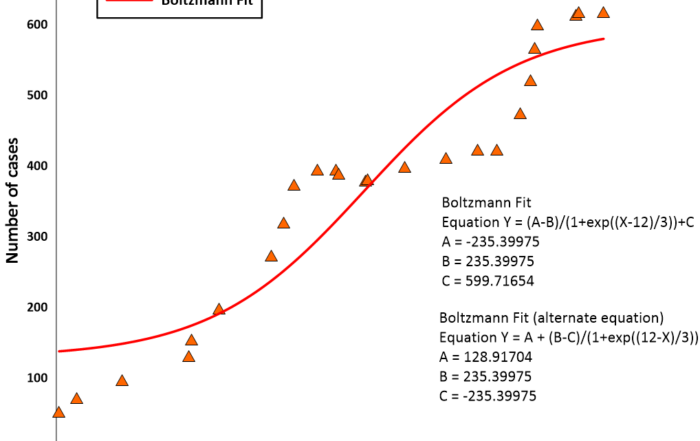
Scatterplot
What it is: A scatterplot displays data points along two axes—horizontal (x-axis) and vertical (y-axis)—to showcase relationships between two variables.
When to use it: Scatterplots are ideal for illustrating patterns or correlations between two things, such as how one variable changes in relation to another. This type of data visualization is commonly used in scientific fields.
How to use it well:
- Keep your audience in mind, as scatterplots can feel complex to those unfamiliar with them.
- Use color or size to highlight patterns or clusters without overwhelming viewers.
- Limit the number of data points to avoid clutter.
Line Graph
What it is: A line graph uses lines to connect data points, typically to display trends over time. It can show a single series of data or multiple depending on your needs.
When to use it: This is the go-to for visualizing data across consistent time intervals (e.g., months, years) to highlight trends or changes.
How to use it well:
- Ensure time intervals are consistent. For example, don’t mix decades with yearly data—it misleads viewers.
- Use multiple lines sparingly. Too many lines can overwhelm the audience and obscure key takeaways.
- Add clear labels and legends for easy interpretation.
Slopegraph
What it is: A slopegraph shows how data points change between two categories or time periods. It uses lines to connect values across categories, visually emphasizing increases, decreases, or differences.
When to use it: Slopegraphs are particularly effective for comparing before-and-after scenarios or analyzing survey results over two time periods.
How to use it well:
- Keep the design simple, avoiding excessive data points.
- Highlight the most critical slopes or categories with bold lines or distinct colors.
- Include labels directly on the data points to eliminate the need for a legend.
Vertical Bar Chart
What it is: A vertical bar chart, or column chart, uses bars to represent data, making it easy to compare values across categories.
When to use it: Use vertical bar charts for comparisons across categories, especially when you have a limited number of categories and values.
How to use it well:
- Avoid overloading the chart with too many data series.
- Use consistent spacing and group categories logically.
- Ensure colors are clear and avoid overly complex color schemes.
Stacked Vertical Bar Chart
What it is: A stacked vertical bar chart combines multiple data series in a single bar, allowing you to see both totals and subcomponents.
When to use it: This type of chart is useful when you need to show the total across categories and break down the components within each category.
How to use it well:
- Be mindful of how many subcomponents you include—too many can make the chart visually overwhelming.
- Use a consistent and intuitive color palette to make comparisons easier.
Horizontal Bar Chart
What it is: A horizontal bar chart flips the traditional vertical bar chart on its side, making it easier to read.
When to use it: This type of data visualization is perfect for categorical data, especially when category names are long. It’s also ideal for ensuring legibility and logical flow.
How to use it well:
- Position categories in a logical order (e.g., descending or ascending values).
- Keep the design clean and simple, avoiding unnecessary embellishments.
- Leverage the left-to-right reading direction to ensure clarity and quick comprehension.
Stacked Horizontal Bar Chart
What it is: Like its vertical counterpart, a stacked horizontal bar chart displays both totals and subcomponents. However, its horizontal format can make long category names easier to read.
When to use it: This is great for visualizing proportions of a whole or survey results along a scale (e.g., strongly agree to strongly disagree).
How to use it well:
- Structure the data to sum to 100% when possible, as this makes comparisons easier.
- Use consistent baselines for subcomponents to allow for intuitive visual comparisons.
- Choose subtle color contrasts to ensure readability.
By understanding what each type of data visualization is best suited for, you can align your data’s story with the right graph or chart to make it as clear and impactful as possible. Just make sure you think about your audience, your message, and the insights you want to highlight before choosing anything—these factors will help you select the right data visualization.
Additional Scientific Visualizations Geologists Should Consider
In addition to the widely recognized visualizations discussed in Storytelling with Data, you’ll likely need to choose between scientific data visualizations to communicate insights to stakeholders. These types of data visualizations weren’t mentioned in the book — but since you’re a geologist, you should know how to pick the best visuals for your data. That said, we’re going to spend a little time exploring some scientific data visualizations and how to determine which ones to use.
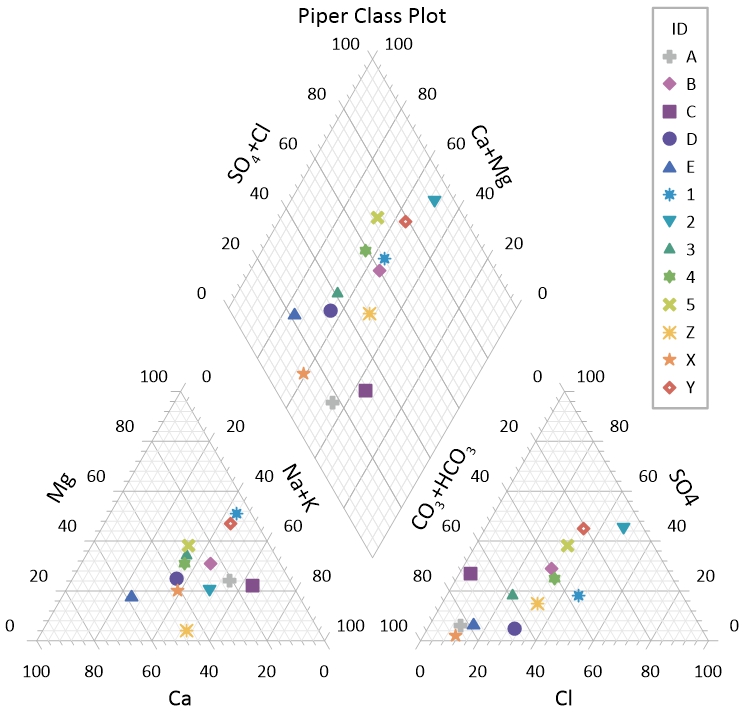
Piper Diagram
What it is: A Piper diagram, also known as a trilinear plot, is a specialized visualization used in hydrogeology to display the chemical composition of water samples from a specific aquifer or location. It combines two triangular diagrams—one for cations (e.g., calcium, magnesium, sodium) and one for anions (e.g., bicarbonate, sulfate, chloride)—with a diamond-shaped plot in the center. Each sample is normalized to 100% for both cations and anions, allowing for direct comparisons.
When to use it: Use Piper diagrams to infer geochemical processes like mineral dissolution, ion exchange, or mixing of water types. They’re particularly helpful in identifying groundwater contamination sources or assessing water quality for human consumption.
How to use it well:
- Group similar samples into hydrochemical facies for easier interpretation.
- Monitor changes over time to track aquifer conditions or identify contamination trends.
- Use consistent symbols and colors for clarity.
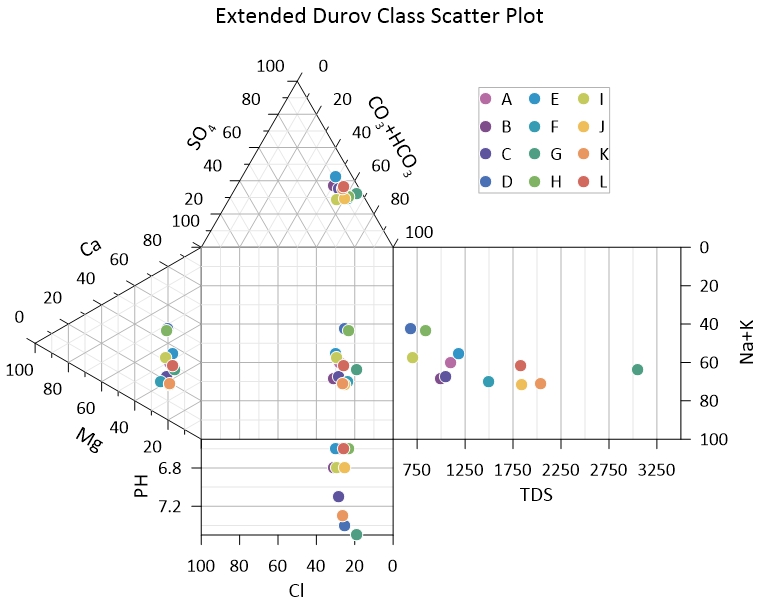
Durov Plot
What it is: A Durov plot is a composite diagram with two ternary plots for cations and anions, plus a central square projection to compare the chemical compositions of multiple water samples. Extended versions may include pH and Total Dissolved Solids (TDS) plots for additional insights.
When to use it: Durov diagrams are ideal for clustering water samples by chemical composition, revealing patterns and relationships within an aquifer. They help track changes over time, assess contamination, and evaluate remediation efforts.
How to use it well:
- Group samples with similar compositions to identify geochemical trends.
- Use extended diagrams for more detailed comparisons, such as pH and TDS levels.
- Highlight significant clusters or anomalies for stakeholder discussions.
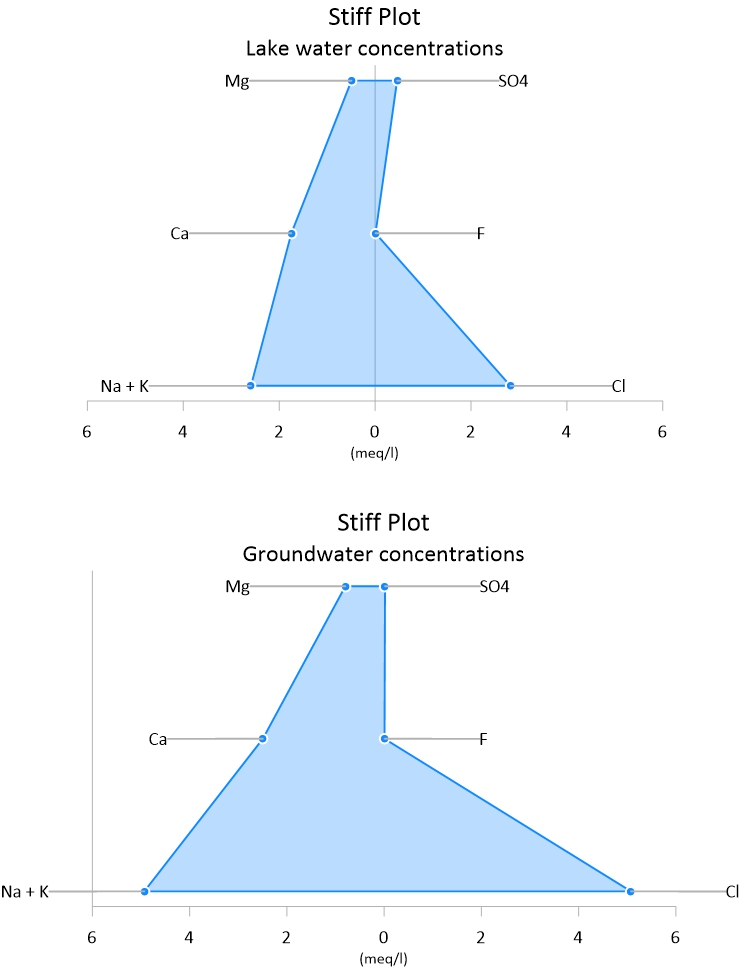
Stiff Diagram
What it is: A Stiff diagram is a graphical representation used to compare the ionic composition of water samples. Cations are plotted on the left side, and anions are plotted on the right, with distances from the center representing concentrations in milliequivalents per liter. Multiple Stiff diagrams are often grouped for comparison.
When to use it: Use Stiff diagrams to compare water chemistry across locations, depths, or time periods. They’re particularly useful for tracking changes in aquifers, such as shifts in dominant ions or contamination levels.
How to use it well:
- Group diagrams by location or depth to identify regional trends.
- Use consistent scales to ensure comparability between samples.
- Track changes over time to highlight evolving geochemical processes.
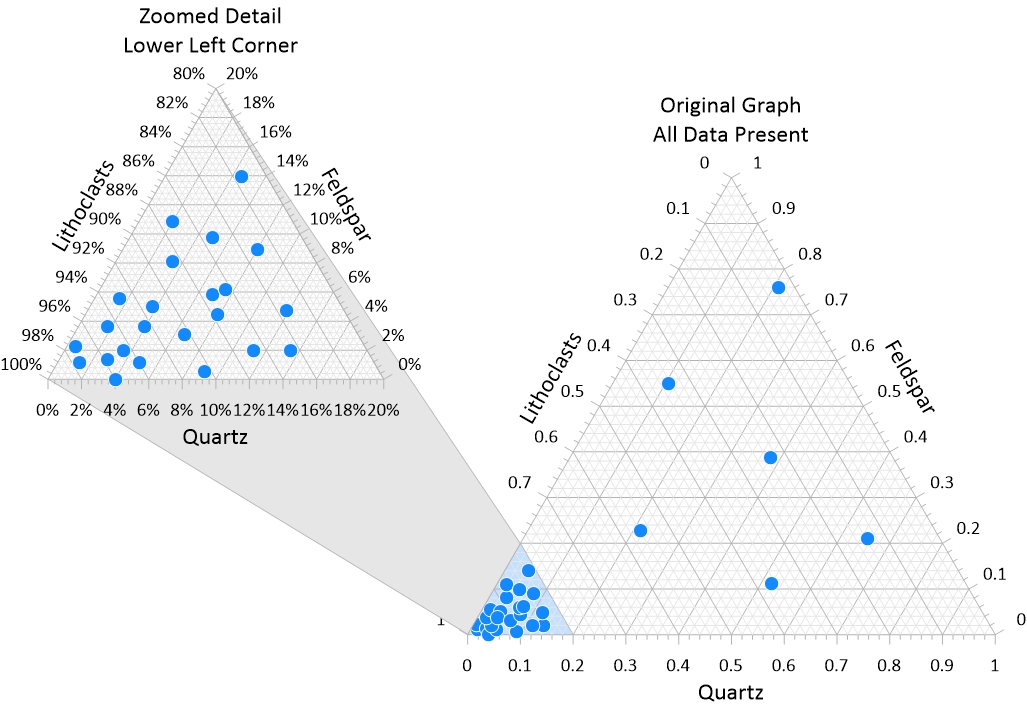
Ternary Diagrams
What it is: Ternary diagrams are triangular plots used to visualize the relative proportions of three components within a system, normalized to 100%. They are commonly used to classify earth materials, such as rocks, soils, and minerals, or to analyze sediment size and composition.
When to use it: Ternary diagrams are valuable for understanding classification systems in geosciences, such as soil composition or lithofacies.
How to use it well:
- Ensure accurate normalization to 100% for precise plotting.
- Use fields or labels to classify data points and provide meaningful context.
- Choose appropriate colors or symbols for different classifications.
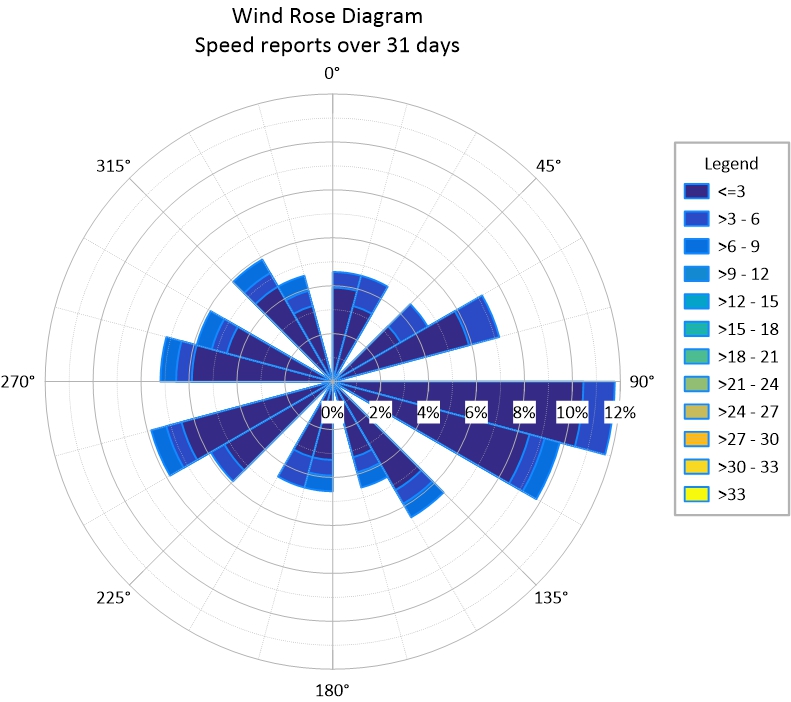
Wind Chart
What it is: A wind rose chart is a circular diagram that shows the frequency and speed of wind from different directions. Each “spoke” represents wind coming from a specific direction, and its length indicates how often the wind blew from that direction. Different colors on the spokes represent wind speeds.
When to use it: Use Wind charts to analyze wind patterns for applications such as site planning, environmental studies, or pollution dispersion modeling.
How to use it well:
- Clearly label wind directions and speed ranges.
- Use consistent colors to represent wind speeds across all data points.
- Simplify the chart by grouping similar wind patterns for better readability.
Whether you’re analyzing groundwater chemistry with a Piper or Durov plot, comparing ionic compositions with Stiff diagrams, or classifying materials with ternary diagrams, each visualization serves a unique purpose. By aligning your visualization choice with the story you’re telling, you can highlight critical patterns, track changes over time, and guide stakeholders toward informed decisions.
Picking the Right Visualization to Amplify Your Story
When it comes to sharing your data’s story, the type of visualization you choose plays a critical role in ensuring your insights are clear, compelling, and impactful. Whether it’s a scatterplot to show relationships, a slopegraph to highlight change, or a Piper diagram to analyze groundwater chemistry, each visualization has a specific purpose that aligns with the message you want to communicate.
By understanding the strengths of different visualization types—both widely recognized graphs and specialized tools used in geoscience—you can match your data’s story to the most effective graph, chart, or diagram. The right visualization not only ensures stakeholders grasp your insights but also keeps them engaged, inspired, and ready to act. Remember, your visualization is the bridge between complex data and actionable decisions. Choose wisely, and your story will resonate far beyond the screen or page.
Ready to explore different types of visualizations? Download a 14-day free trial of Grapher to create stunning traditional and scientific graphs, charts, and diagrams!