A Short Guide: The Purpose of Mainstream and Specialized Map Types
Maps are at the core of what you create as a geoscientist. Whether you’re tracking environmental changes, highlighting geological formations, or analyzing elevation for infrastructure planning, you typically have to create maps to communicate key insights. But what types of maps can you design to effectively showcase data? Quite frankly, there are many options, from familiar formats to specialized visualizations, and you should know them to determine which one to use to best relay information. That’s why we’re diving into the top mainstream and specialized map types and breaking down what they are and what purpose they serve.
However, keep this in mind: our short guide doesn’t provide an exhaustive list of map types (because, let’s be honest, that would be an e-book). Instead, we’re focusing on the maps in Surfer that are either used regularly across industries or could use a little more explanation.
Mainstream Map Types That Continue to Perform Well
Let’s start with the maps that have become commonplace. Among the most widely used mapping techniques in Surfer are color relief maps, contour maps, and base maps. These mainstream map types have stood the test of time, and it’s because they not only serve distinct purposes but are also beneficial to multiple industries. To put that into perspective, here’s some insight into the purpose and applications of contour, color relief, and base maps.
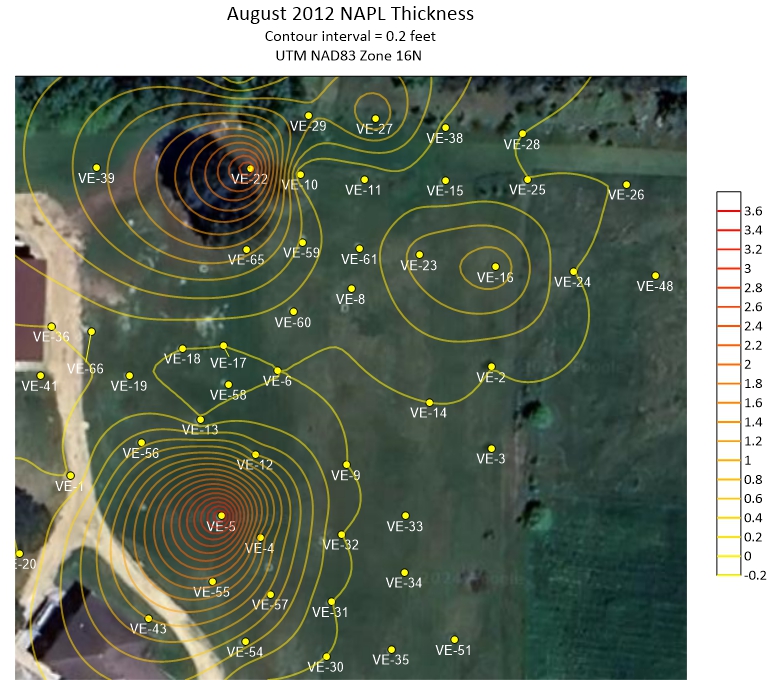
Contour Maps
Contour maps are a staple in data visualization, used to represent elevation, concentrations, and variations in data through contour lines. Each line on a contour map connects points of equal value, providing a detailed yet intuitive way to interpret changes in terrain or other spatial datasets. Because of the precision and clarity they offer, these maps have become indispensable to geologists, engineers, hydrologists, and environmental scientists.
Applications of Contour Maps:
- Geology and Mining – Used to map ore bodies, plan drilling operations, and understand fault lines.
- Civil Engineering and Construction – Essential for planning roads, bridges, and infrastructure while minimizing environmental impact.
- Environmental Science – Helps in monitoring erosion, groundwater contamination, and land-use planning.
- Hydrology and Water Resources – Used for watershed modeling, floodplain mapping, and groundwater analysis.
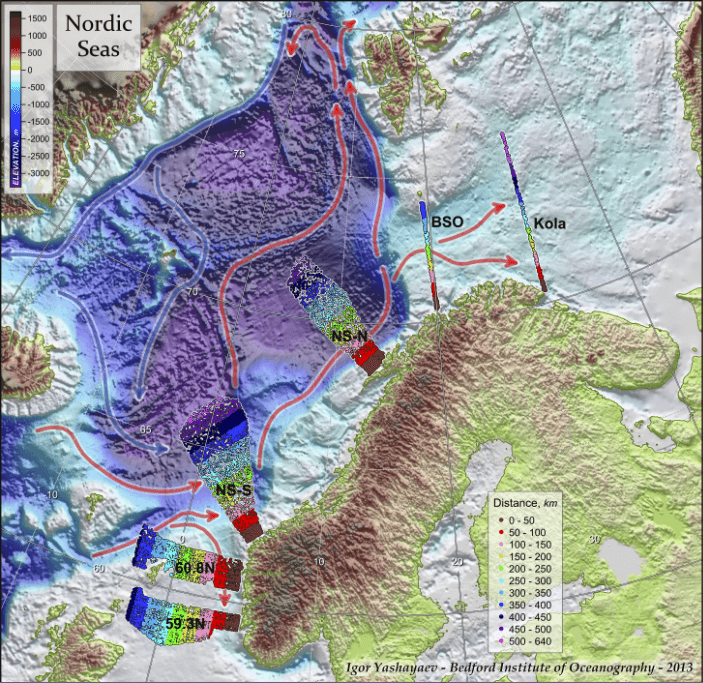
Color Relief Maps
Color relief maps take visualization a step further by applying color gradients to depict elevation changes, surface characteristics, and other data. Unlike contour maps, which rely on lines to indicate variations, color relief maps use shading and color changes to create a more visually dynamic representation of data. Their design makes them aesthetically pleasing and easy to understand, which is why they’re essential tools for quickly conveying complex terrain information in an engaging and intuitive way.
Applications of Color Relief Maps:
- Archaeology – Used to uncover ancient sites and detect subtle landforms that indicate buried structures.
- Urban Planning – Helps planners assess terrain and elevation when designing infrastructure.
- Geology and Mining – Provides a clear view of subsurface features and mineral deposits.
- Environmental Science – Used to model erosion patterns, assess water movement, and study ecological changes.
- Disaster Management – Helps identify flood-prone areas and assess the impact of landslides or earthquakes.
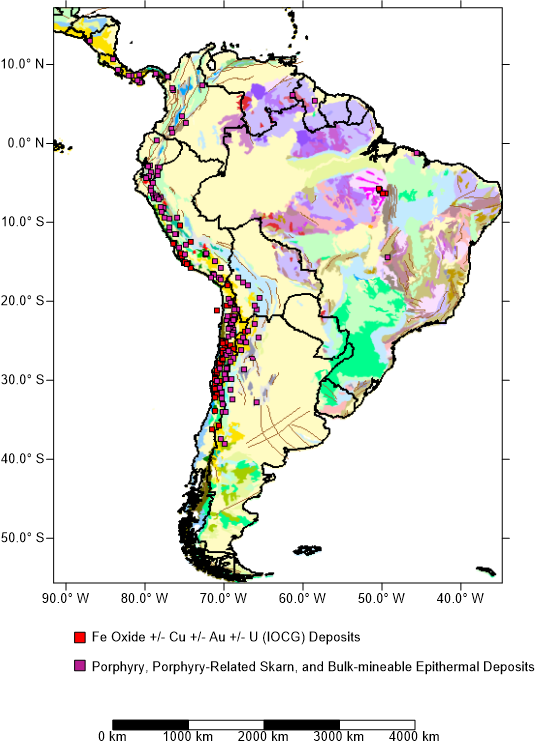
Base Maps
Base maps are the backbone of any meaningful geographic analysis, providing a reference layer that helps orient data within its real-world context. Whether you’re mapping geological formations, tracking environmental changes, or planning infrastructure, base maps serve as the visual foundation that ties everything together.
They display key features like roads, rivers, highways, lakes, and boundaries, offering essential context for interpreting and delivering insights. You can create base maps from many data sources in Surfer, including vector data, tabular data, and even high-quality imagery from online mapping servers such as Google Maps and OpenStreetMap.”
Specialized Map Types That Can Enhance Your Workflow
While mainstream map types like contour and color relief maps are go-to visualizations, specialized maps also help you convey deep insights if you’re working with unique datasets. Whether analyzing water movement, subsurface drilling data, land depressions, or high-resolution 3D landscapes, specialized visualizations are indispensable for environmental and geological studies. To bring that point home, we’re going to dive into four powerful specialized map types: watershed maps, drillhole maps, peaks and depressions maps, and point cloud maps—each designed to deliver precise insights for analysis.
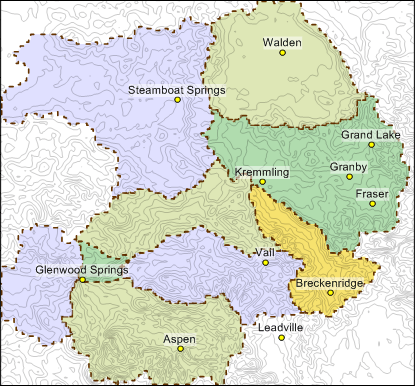
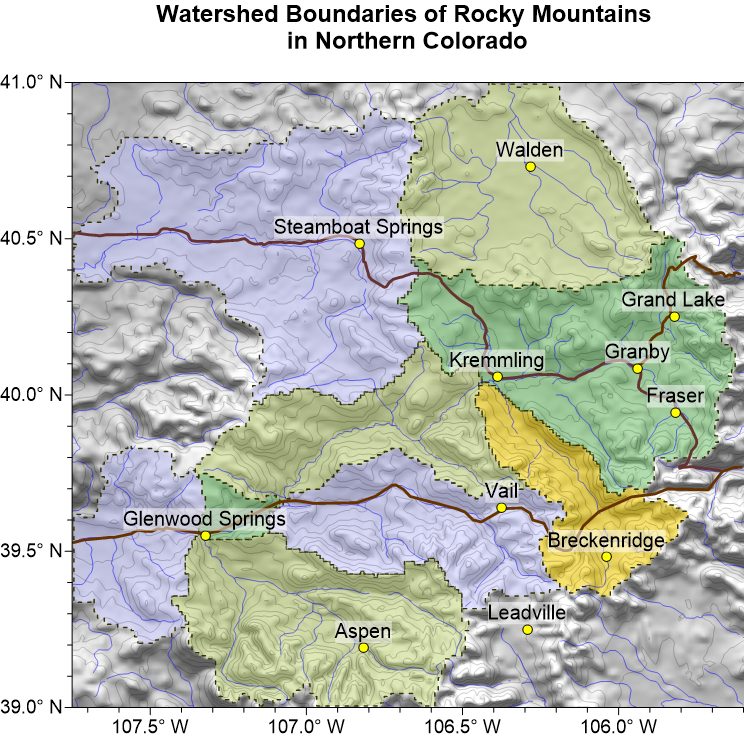
Watershed Maps
A watershed map visually represents the boundaries of a drainage basin, displaying how water flows across a landscape. These maps typically feature elevation data, river and stream networks, and the highest points of a basin, showing where water collects and channels toward an outlet. Geologists, urban planners, and environmental managers use watershed maps to guide land use planning, predict flooding, and assess ecosystem health.
Applications of Watershed Maps:
- Hydrology & Flood Control – Helps predict flood-prone areas and plan mitigation strategies.
- Water Quality Monitoring – Assists in identifying pollution sources and tracking water movement.
- Urban & Infrastructure Planning – Ensures proper drainage for developments, preventing water-related issues.
- Environmental Conservation – Aids in protecting aquatic habitats by mapping runoff and water flow patterns.
Drillhole Maps
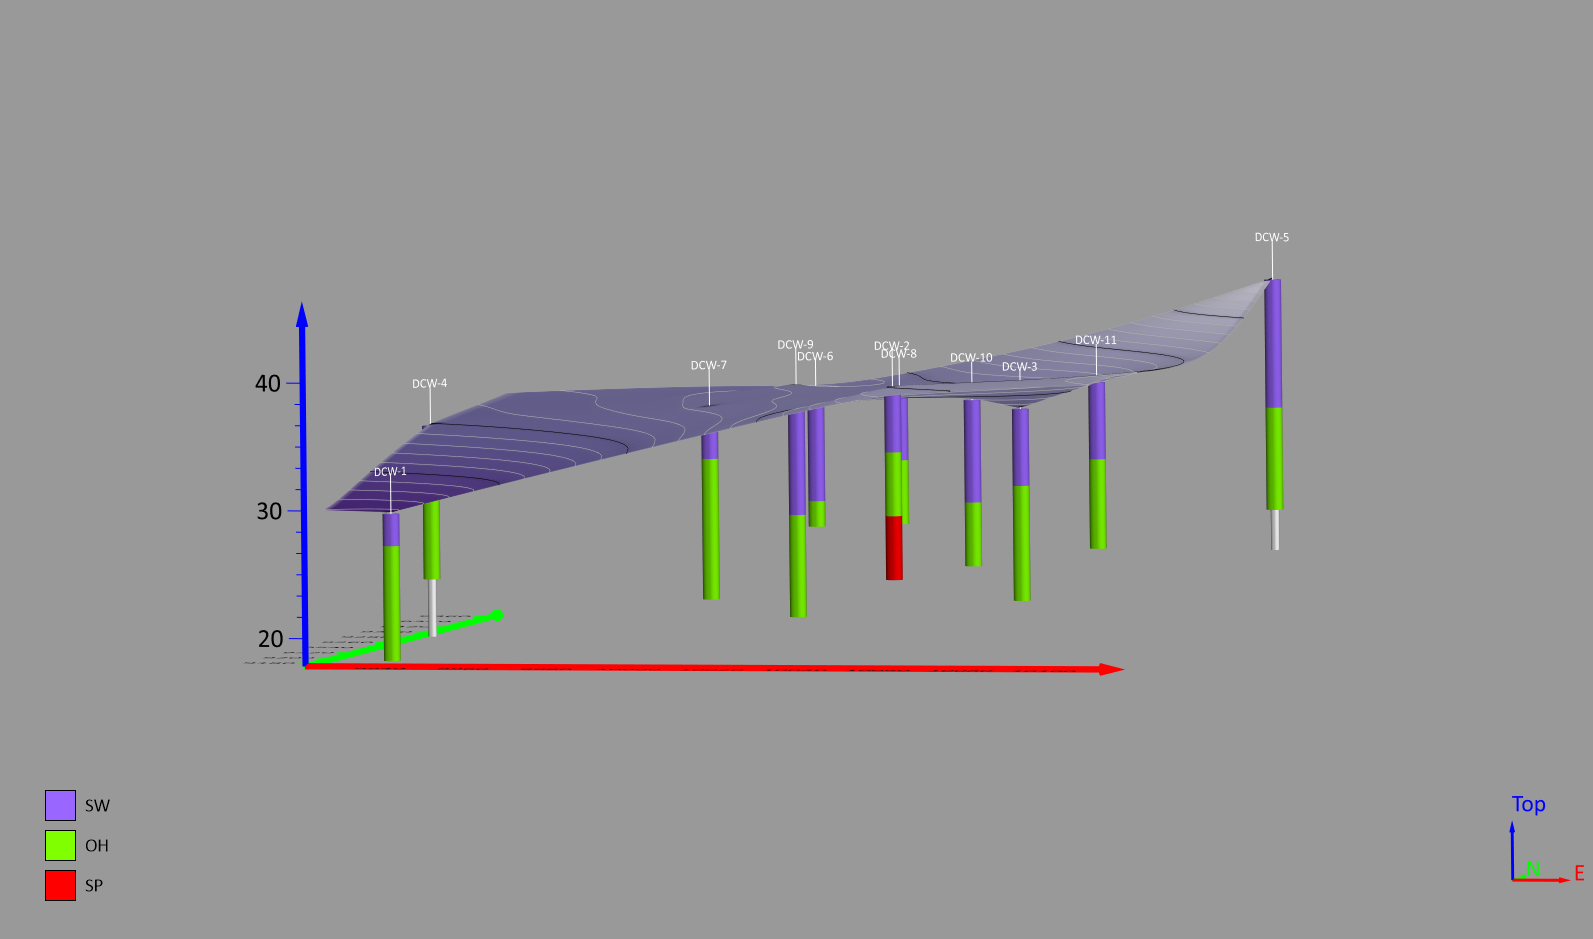
A drillhole map visualizes the locations and paths of drilled wells, boreholes, or cores in both 2D and 3D views. In 2D drillhole maps, you can see the top-down placement of drillholes, while 3D drillhole visualizations reveal their depth, orientation, and deviations.
Surfer’s drillhole mapping capabilities, in particular, equip you to import drillhole data, display color-coded points and intervals along the drill path (e.g. lithologies, mineral concentrations, or geophysical data), and label drillholes to communicate findings effectively.
Applications of Drillhole Maps:
- Mineral Exploration – Showcases ore deposits and guides extraction efforts.
- Groundwater Analysis – Highlights aquifers and contamination plumes.
- Oil & Gas Exploration – Maps well paths and evaluates resource potential.
- Geotechnical Engineering – Illustrates soil stability for construction and infrastructure projects.
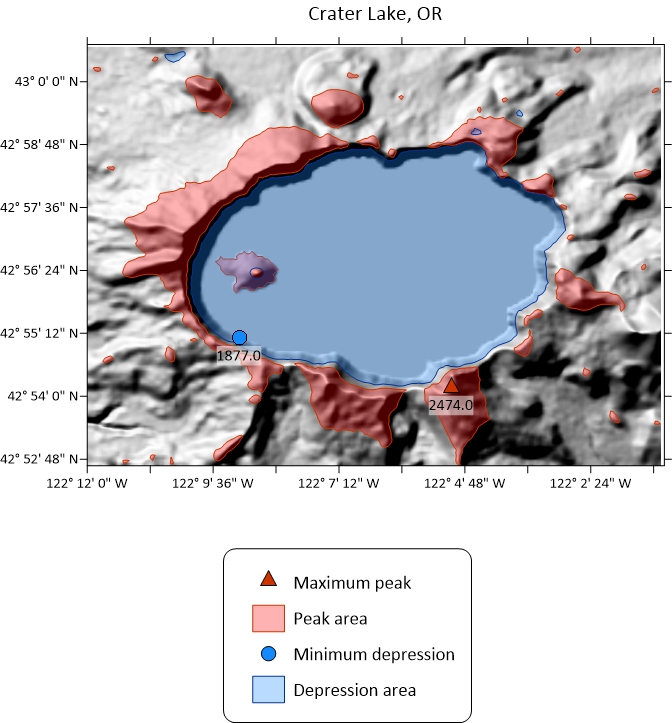
Peaks & Depressions Maps
Peaks and depressions maps are essential tools for analyzing terrain features, water movement, and land stability. These maps identify high points (peaks) and low points (depressions) in a landscape. With these maps, you and stakeholders can better understand how water interacts with a landscape, how geological structures evolve, and where potential hazards like sinkholes may form.
Applications of Peaks & Depressions Maps:
- Hydrology & Water Resource Management – Points to natural reservoirs, groundwater recharge areas, and potential flood zones.
- Geology & Karst Topography Studies – Maps sinkholes, caves, and underground water systems.
- Agriculture & Land Use Planning – Helps determine optimal drainage and irrigation locations.
- Construction & Infrastructure Development – Showcases land stability before large-scale projects.
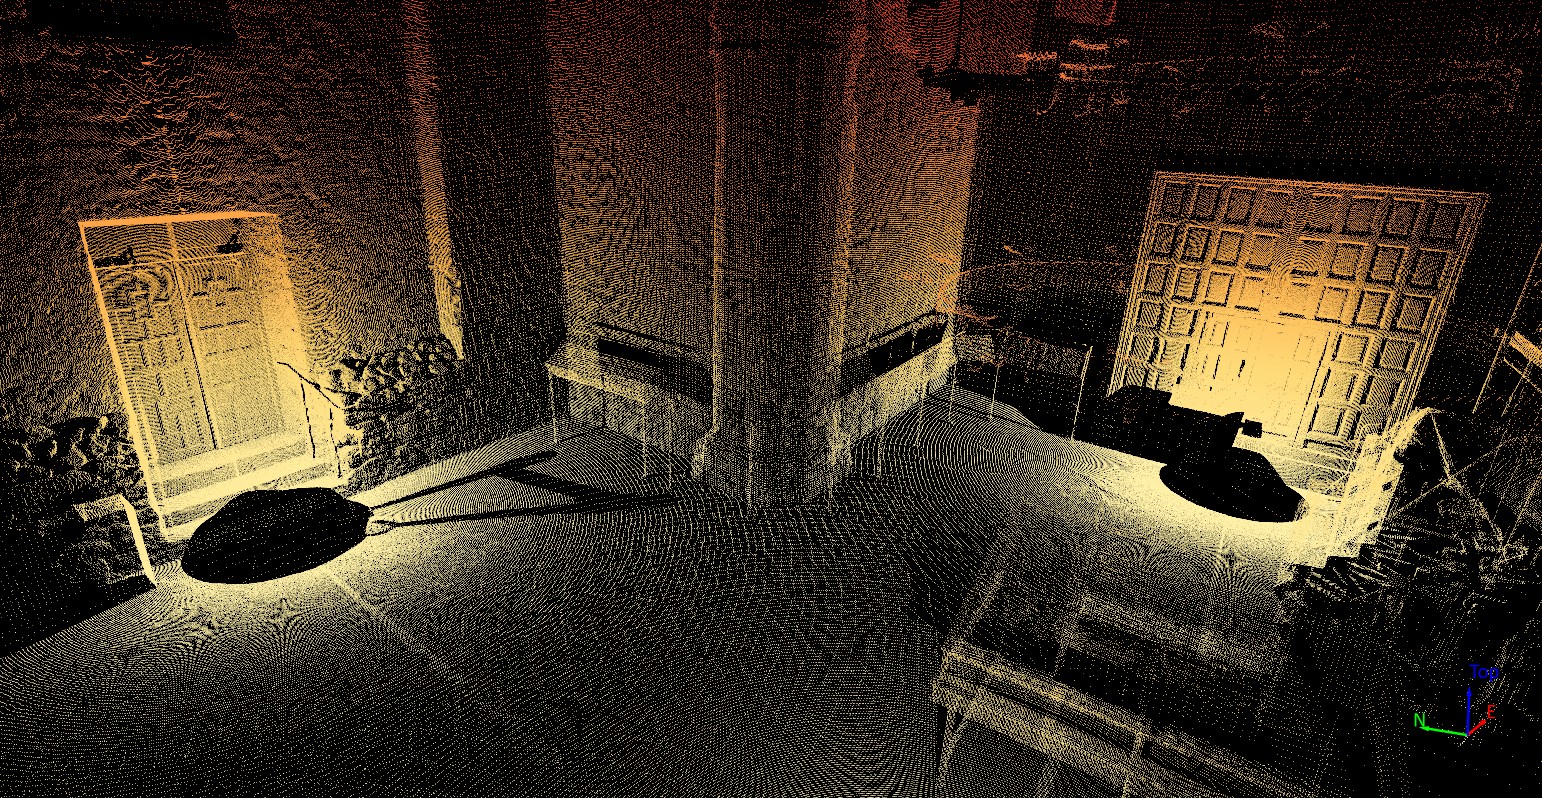
Point Cloud Maps
A point cloud map visualizes millions of individual points, providing highly accurate representations of real-world environments. Each point in the dataset represents a measured coordinate (X, Y, Z), and when combined, they form an intricate digital model of a surface, whether it’s a cityscape, a mountain range, or an underground cave system.
Applications of Point Cloud Maps:
- Disaster Modeling – Highlights flood risks, landslide potential, and earthquake damage.
- Forestry Management – Tracks tree canopy density, biomass estimation, and deforestation patterns.
- Urban Planning – Shows 3D models of buildings, roads, and infrastructure.
- Mining & Geology – Maps mineral deposits, quarry operations, and underground structures.
Choosing the Right Map for the Right Job
From widely used contour, color relief, and base maps to specialized watershed, drillhole, peaks and depressions, and point cloud maps, there are countless ways to visualize data effectively. The key is understanding the purpose and applications of each map type and then selecting the best one for your specific needs.
If you’re looking for a high-level view of elevation, a contour map will offer more clarity and visual impact. However, if you’re analyzing water flow, a watershed map or peaks and depressions map may be better—and the one you choose will depend on the purpose of your project and the industry you’re in.
Ultimately, the goal is to know the top mainstream and specialized map types available and pick the right one for your project. There are too many types of visualizations—in Surfer specifically—to just use one or a couple repeatedly, especially if you work with different types of datasets. So, when you’re about to create another map, think about the type of visual that will help you relay insights the best. If that means trying something new, don’t be afraid to do it!
Not a Surfer user yet but want to create one of the maps listed in this article? Download a 14-day free trial of Surfer to start communicating your insights using a mainstream or specialized map type!
About Gabbie
")
Gabbie Rhodes joined Golden Software in August 2024 as a member of the Sales and Marketing Team. She holds a Bachelor’s degree in Journalism with a minor in English from the University of Missouri-Columbia. Gabbie’s professional experience in content marketing includes five years as a freelance writer, during which she developed a passion for crafting content that helps brands build traffic, trust, and differentiation. She’s excited to use what she’s learned to engage and inform Golden Software’s customers.
Gabbie lives in Chicago, where she enjoys walking around the city and exploring new places. In her free time, she also enjoys writing, reading speculative fiction, drinking chai, watching anime, spending time with family and friends, and serving at her local church.