8 Reasons Grapher is the Perfect Tool for Students
The start of Fall Semester for most schools is already underway, but there is one back to school supply that you may not realize is the perfect tool for you or a student in your life, Grapher!
Grapher is a great software package for anyone who needs to generate publication quality graphs and can quickly become a student’s best friend. Grapher can be a powerful tool; whether you are looking to impress your professor for your mid-term project, visualize the data you gathered for your thesis defense, or even shooting for first author on your latest publication submission!
Here are 8 reasons why Grapher is such a great tool for students:
1. Student Budget Friendly Pricing
A Grapher student license comes in at a very cost-effective price point of $50 for an annual license. Other student graphing software can run up to $70 annually and may not even offer the number of features Grapher does! All a prospective student has to do is email us from their university account and provide proof of current enrollment. If your university is looking for a large-scale software solution, check out our education license solutions that can quickly scale to your needs.
2. Easily Transition Between Multiple Programs
Grapher is able to easily transition between several prominent programs that are often offered for free to college students, e.g., the entire Microsoft Office suite. Providing a frictionless experience from worksheet set up, to export. Regardless of what program you finish your final reports in.
3. Countless Import and Export File Options
Along with being able to easily transition between programs Grapher is able to import and export files in a wide range of popular file formats. Including, but not limited to ACCDB, DBF and XLSX. You can view all of Grapher’s supported file formats here: Supported File Formats. With so many options available you can easily share your visualizations across multiple platforms at your university.
4. Preview Data with the Graph Wizard
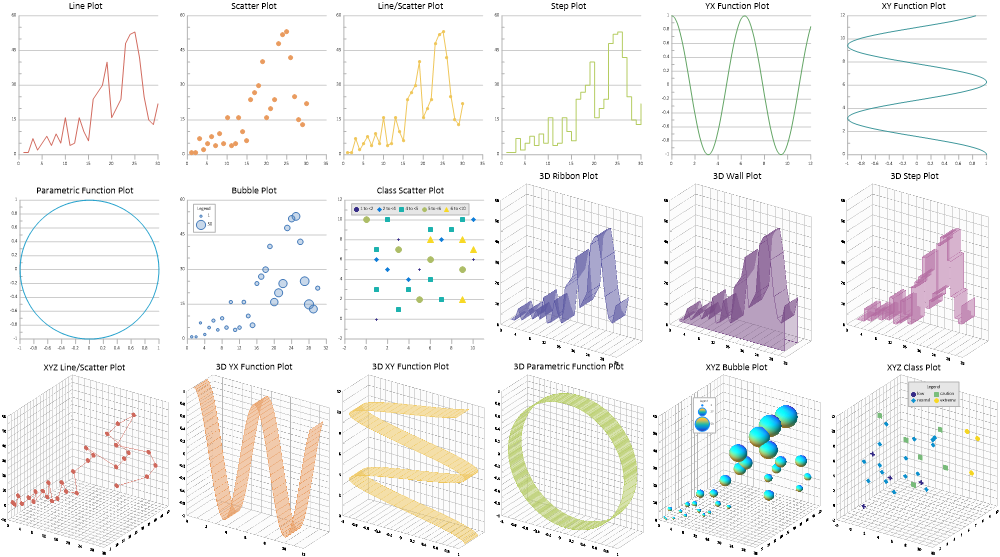
Grapher offers 85 unique graph types which you can explore with the Graph Wizard. Simply load your selected data and then choose from the extensive range of plot types. In the Graph Wizard you can scroll through previews of what plot types look like and search by plot category, plot name, or previously used graphs. You can even star your most-used plot types and save them under the favorites category for quick and easy access to the plot types you use most. Finally, you can map your data to the proper axes and set the properties for your legend, title, labels, color scheme, and more all while still within the Wizard dialog!
5. Simple Data Labeling
All the great data you collect in the field or lab means nothing without easy-to-understand labels. Grapher offers easy labeling and label customization for your data points, axes, and titles from the property manager. If you want to precisely set your labels in your original data worksheet that’s possible too. Customization options include label variables, data format, label position, angle, and more! Grapher even offers visually striking ways to focus on important portions of your data after you set your custom labels with inset zooms such as the figure below.
6. Advanced Mathematical Functions
Grapher lets you take the next steps in analyzing your data with a multitude of mathematical functions. You can modify your data with the Data Tools | Data | Transform command in the worksheet. There are tons of prominent built-in functions you can choose from such as trigonometric and exponential functions. Or, you can perform conditional evaluation by writing your own If, Then functions. And if creating new data doesn’t interest you, simply create function plots automatically in the plot window and enter the function equation you desire in the property manager for your new plot!
7. Fit Curves
When it’s time to present your findings, few things help drive the point of your data home like a Fit Curve. Easily add one of the 17 pre-defined fit curves to your data such as gaussian distribution or polynomial regression directly from the top ribbon. Or, define your own custom fit curve with the custom fit equation and parameters that help you best tell the story of your data.
8. Templates
Have you ever spent time creating a plot and fallen in love with the format options? With Grapher you can save those options as a .GRT template file that you can apply to any future compatible data you have by using the File | New | Plot from Template command. This works great if you regularly generate reports for a lab on campus, or if you know the journal you are submitting your research to has a required format for all figures. Save some of your precious time and create uniform figures with Grapher’s template graphs.
That will wrap up this list of reasons why Grapher can be a powerful tool for students. Each year hundreds of students from top universities all over the world purchase a Grapher student license. If you or a student in your life are interested in taking their data visualization to the next level, get in contact with our Customer Support Team at sales@goldensoftware.com today!


