Clean up your Contours: Minimize LiDAR Noise
LiDAR data continues to be more and more prominent in nearly every aspect of geoscience. Whether you are a hydrologist mapping watersheds, or an archeologist performing impact assessments; the ability to understand and utilize LiDAR data will give you an advantage in your field.
With this ever-growing relevance it is imperative that geoscientists learn the tricks of the trade to create the best possible visualization output from LiDAR data. Surfer has simple workflows to create point cloud maps, but what can you do before and after that point cloud is generated to create the most visually appealing map possible?
Read below to learn what causes LiDAR noise and 2 methods using Surfer to minimize the noise and generate smoother contours maps from LAS and LAZ data files.
What Causes LiDAR Noise?
LiDAR data is collected by drones or scanners. When there are small differences in elevation between closely spaced points in the scanned area, the resulting output file can contain the visual phenomenon that is known as LiDAR noise.
This noise can present itself as artifacts in contours when creating maps from LiDAR data collected in areas matching this description. The map pictured to the right highlights areas where LiDAR noise is present.
.
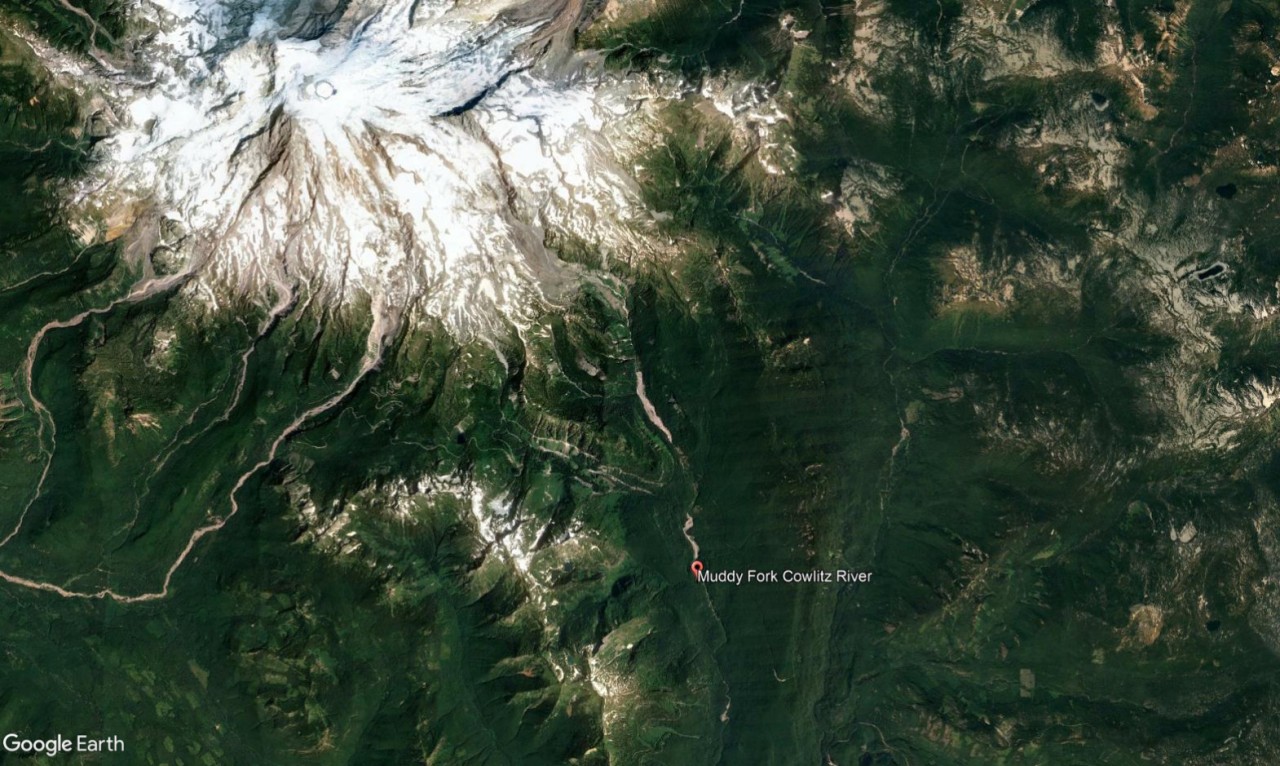
The LAZ files used to demonstrate this noise are 3 LiDAR tiles downloaded from the USGS Topographic Map Resource. The data was collected by drone in Mount Rainier National Park.
LAZ files tend to very dense, all 3 files used in the above map combine to have more than 28.2 million data points. The scanned area is near the base of the mountain where several creeks feed into the river, leading to elevation differences in close proximity. Due to these two factors, when creating contours from a point cloud using Surfer’s default settings there are noticeable noisy areas.
Workflow 1: Apply Grid Filters to the Point Cloud
One method to reduce this contour noise is to utilize Surfer’s Grid Filters once your Point Cloud layer has been converted to a grid.
Once a Point Cloud layer has been created Surfer offers a quick and easy tool to generate a grid from the point cloud. From the Point Cloud tool bar just select Features | Create Grid
This command creates a grid file based on the already existing point cloud. As soon as that point cloud has been converted to a grid, we can now apply Surfer’s grid filter features to try and smooth some of the noise out.
To apply a grid filter to an existing grid you can select Grids | Edit | Filter. The Filter command applies methods of digital image analysis to grids. This includes a broad suite of smoothing (low-pass) filters, as well as contrast enhancement filters, edge enhancement filters, edge detection filters and general high-pass filters.
In the Grid Filter dialog we can notice there are two filter types: Linear Convolution Filters and Nonlinear Filters. A linear convolution low-pass filter removes the high frequency noise with the resulting output being a smoother grid. For the purpose of reducing contour noise, a linear convolution low-pass filter works perfectly. Each low-pass filter option uses the same base equation. The factors that change between each option are the size and shape of the filter neighborhood and the specific weights used.
To determine which filter creates the best visual output you can apply the old-fashioned trial and error method. Testing each low-pass filter option by creating a corresponding new grid.
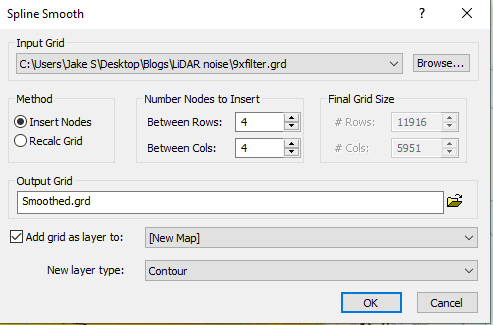
After applying a grid filter there can sometimes still be noticeable noise that could be further reduced. To address this you can use Surfer’s Spline Smooth command. The Spline Smooth command uses cubic spline interpolation to compute new grid nodes. The interpolation simulates a drafting technique where a flexible strip (a spline) is used to draw a smooth curve between data points. To open the Spline Smooth dialog click Grids | Edit | Spline Smooth.
Within the dialog you can choose either the number of nodes you wish to insert between each row and column, or to recalculate the grid to an exact size specification.
A comparison of the original contour map with noise present to the filtered and smoothed one with noise reduced is pictured below.
Workflow 2: Create a Grid Directly from the LAS/LAZ File
A strength of Surfer is its wide range of supported file formats. This strength extends to gridding as there is a laundry list of supported import data types to create a grid from. Included in the list are LAS and LAZ files, meaning Surfer has the ability to directly grid LiDAR data without first creating a point cloud. Utilizing this direct gridding technique can reduce your eventual contour noise thanks to the specific set of import options tailored to LiDAR data.
These options are included in the LiDAR Import Filtering dialog. The LiDAR Import Filtering dialog offers filtering options that can reduce point density, reject inconsistent data points, and set exact XYZ specifications. For this workflow, to reduce contour noise we are using the Sample Filtering | Nth point option. The Sample Filtering options are used to thin data.
When the Nth point box is checked any number entered will filter out every Nth point of the LAS fie. By setting the value to 2, half the overall points in the LAS file are filtered out. Reducing the total number of data points from 8,840,106 to 4,420,053. If it was desired to remove every third point one would enter the value as 3, and so on.
When using this direct gridding workflow you can only grid a single LAS file at a time. Meaning if your raw LiDAR data is contained in 3 separate LAZ files this it is required to go through the gridding process 3 times and apply the same Sample Filtering options to each new grid. Below you can view what 3 separate LAS files look like when gridded and added to the same Map Object as separate contour layers.
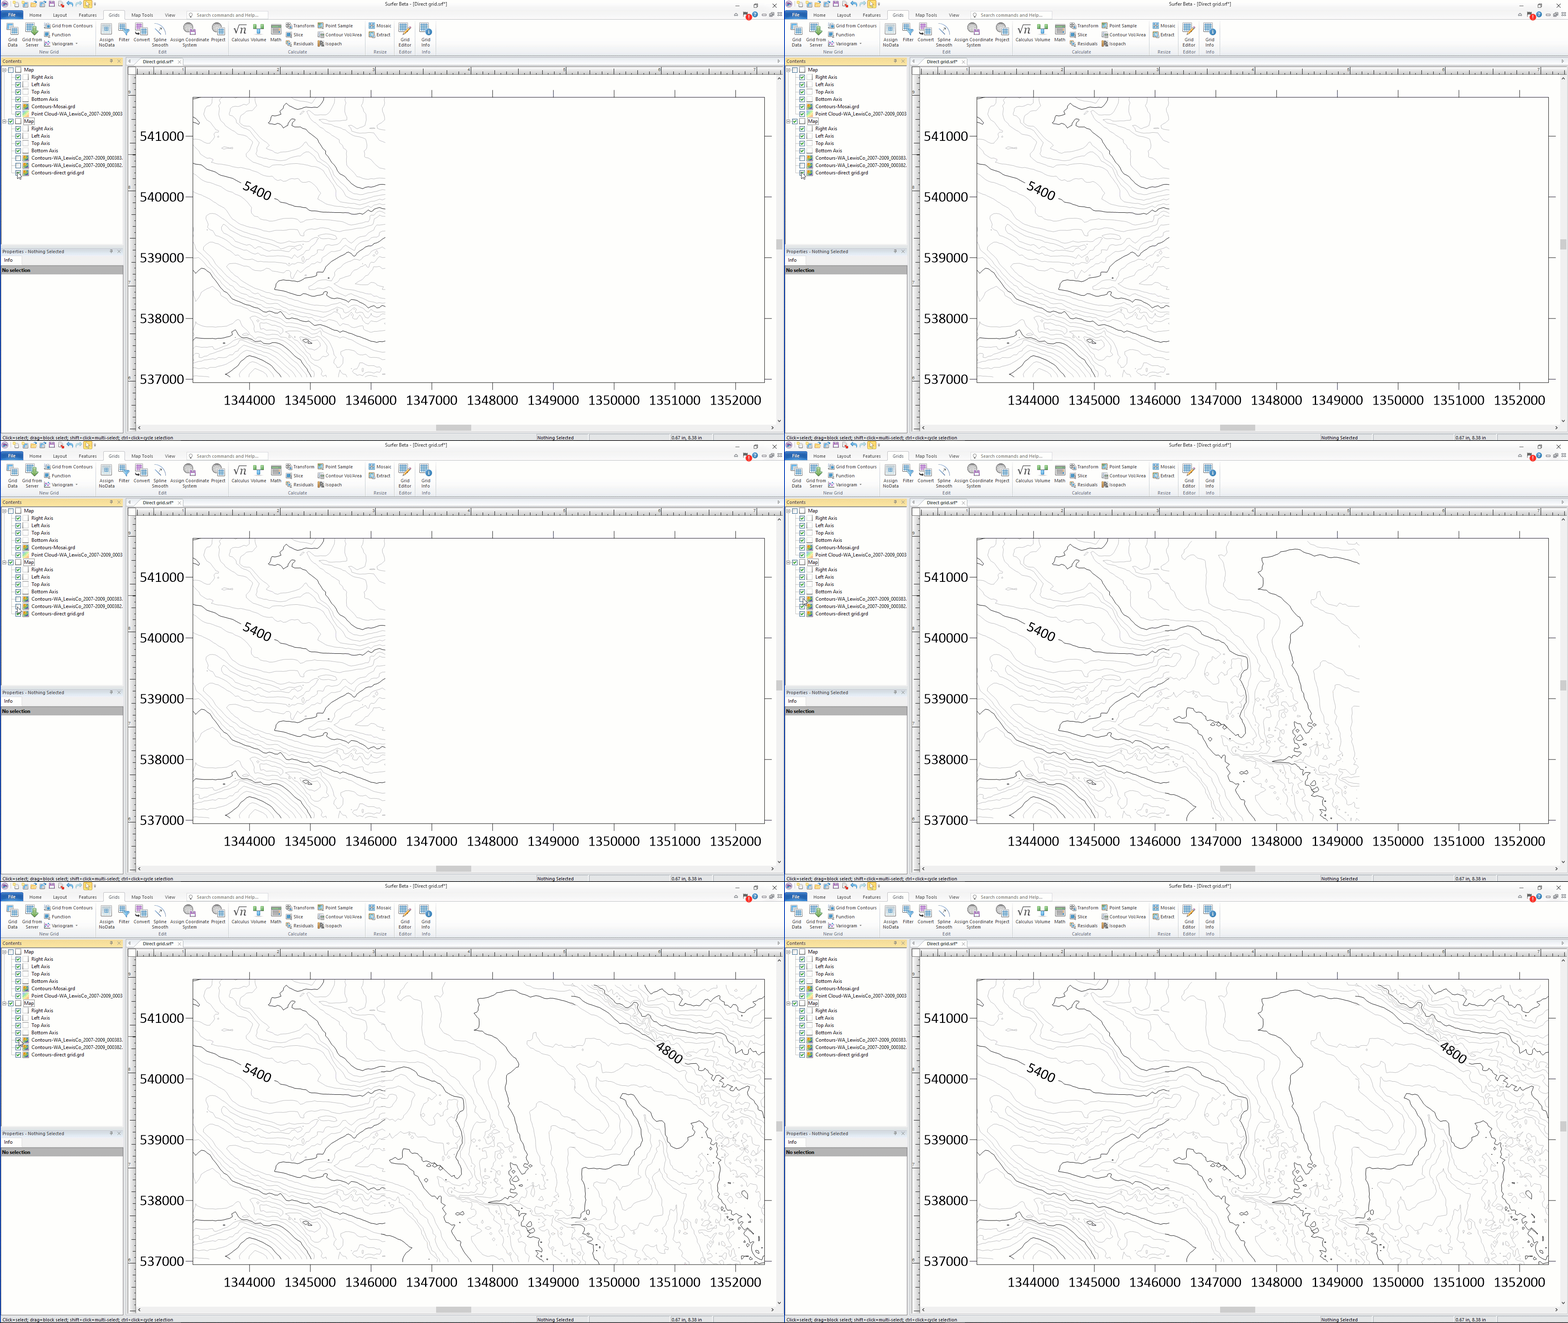
The contour noise in those previously highlighted areas is noticeably reduced, but there are now 3 patchwork contour layers in the same map. A stakeholder with sharp eyes may even notice the seams between those 3 layers.
To resolve this we can combine the grids using the Grid Mosaic command. The Grid Mosaic command combines two or more input grids of the same coordinate system into a single output grid. To mosaic any set of grids click Grids | Resize | Mosaic.
The final output after directly gridding the 3 LAZ files using the Nth Sample Filter, then applying a Grid Mosaic is shown in comparison to the original “noisy” contours below.
The filtering applied to create the above final grid was quite strong. Accordingly, in the examples outlined in this article the Direct Gridding workflow lead to a more prominent noise reduction than applying Grid Filters after the grid was converted from a Point Cloud.
If a higher value in the Nth point options was utilized there may be more noise present, but there would also be more original data points. The final product is still an accurate representation of our original LAZ files even with less data points.
If you are concerned about reducing your data points, or extra data interpolation from gridding, Workflow 1 would be best for you. If you only have a single LAZ file and are looking to reduce noise quickly, then Workflow 2 would be recommended.


