Site Suitability Analysis for ‘Blue Energy’ Locations
The University of Queensland in Brisbane, Australia, is using Golden Software’s Surfer, Grapher, and Strater packages to pinpoint the ideal offshore locations for placing wave energy devices to generate sustainable electricity. The region’s first operational installation, developed by Wave Swell Energy of Melbourne, has been installed off the coast of Tasmania with input from the Queensland researchers.
‘Blue Energy’ is a promising form of sustainable power that relies on either tidal or wave action to generate electricity, explained Craig Heatherington, a marine geologist in the University’s Civil Engineering Department.
The technology’s implementation has been slowed by the relatively high expenses related to maintaining turbines in corrosive saltwater environments. Wave Swell Energy has attempted to minimize this problem by developing a design that uses wave action to create a vacuum that pulls air through turbines above the water line.
“There’s little to no saltwater intrusion, which reduces maintenance and improves overall project economics,” said Heatherington.
To operate efficiently, the wave energy devices must be installed in precise locations satisfying several parameters. The wave action, for example, has to meet minimum thresholds without being so rough as to damage the machinery. In addition, the unit must be placed in water of about four to six meters average depth with the right seafloor slope so that waves enter the chamber at the correct level. And the seafloor sediment needs to be stable and thick enough to prevent the heavy device from settling over time.
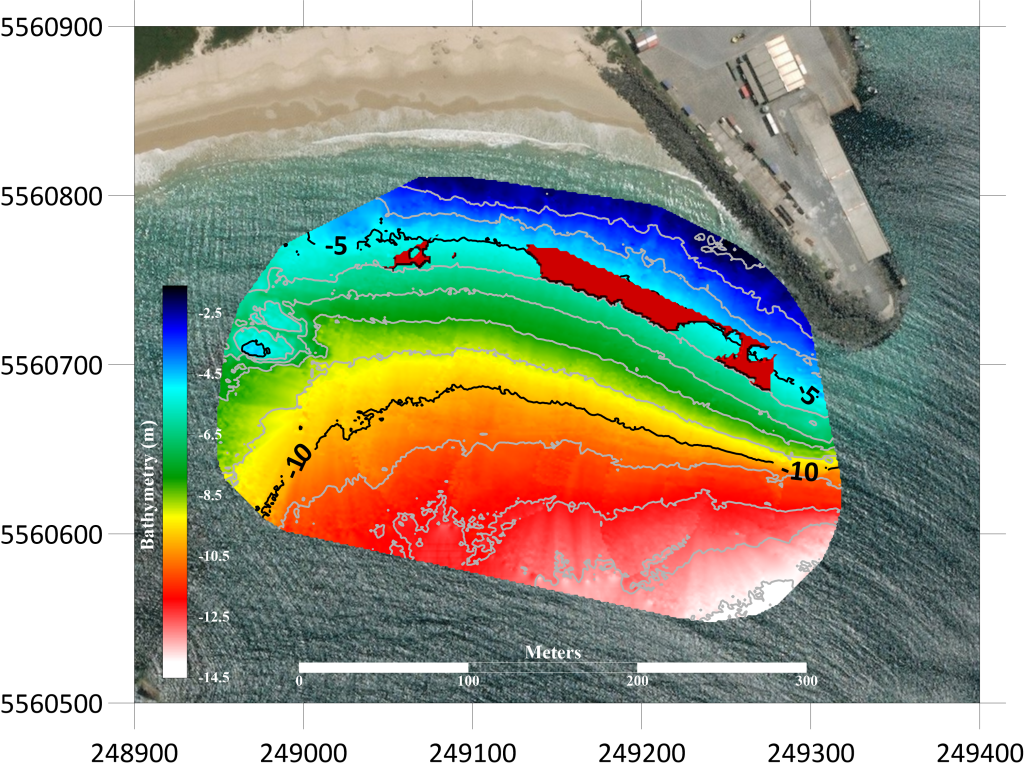
Wave Swell selected Tasmania’s King Island in the Bass Strait – known for its intense wave action – for the first installation and then turned to the Queensland researchers to pinpoint the ideal location on the coastline. From there, it was up to Heatherington and his team to analyze key factors in deciding where the unit should go. Working – and sometimes scuba diving – from small boats in the surf just offshore, they collected data necessary to model the littoral zone.
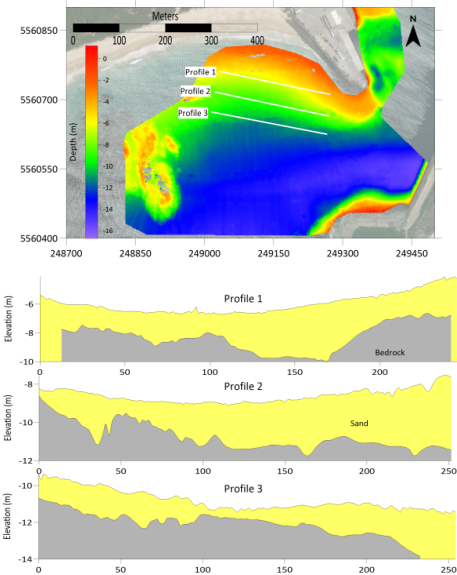
“We performed acoustic surveys of the seafloor bottom to collect bathymetric measurements, sub-bottom acoustics, and we took piston core samples to gather sediment for analysis,” said Heatherington. “Where the piston core encountered bedrock, we were able to add a ground-truthed data point to the bedrock interpolation with the sub-bottom dataset. “
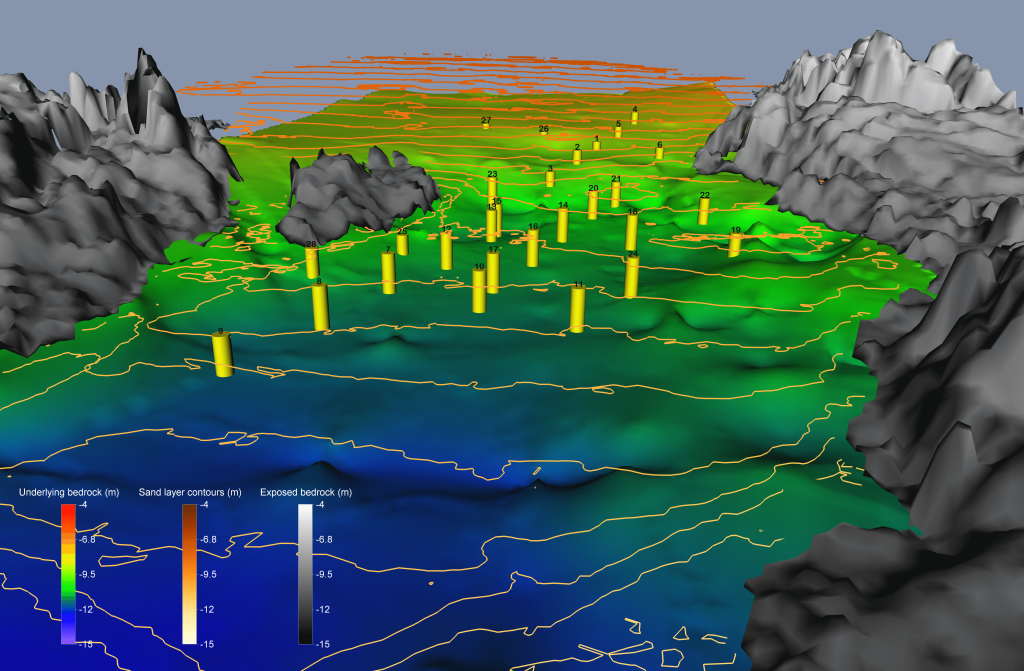
Back on shore, the scientists modeled the data sets in Golden Software packages. Sub-bottom bedrock interpretation points were input into Surfer where a kriging function was applied to create a map representing the shape and slope of the bedrock underneath the seafloor. The GPS-stamped core samples were loaded into Strater and then combined with water depth measurements in Surfer, generating a 3D model of both the sediment layer and the water column – two of the most critical pieces of project information.
Another important role for the core samples was to map the lithology of the sandy sediment. A particle size distribution, revealed in the lithologic analysis, was generated in Grapher. The researchers were looking for anomalies in the sediment that might adversely impact stability. Such anomalies might include a high percentage of particles on either end of the size spectrum, like smaller clays or large pebbles. None were found, so the team moved forward with a traditional Triaxial test of sediment stability.
Heatherington said he uses the three Golden Software packages for marine survey projects instead of ArcGIS because Surfer, Grapher, and Strater are intuitive and easy to use. Of the many advantages these applications offer, he is most impressed with the power of kriging in Surfer which outputs accurate surface maps interpolated from measured XYZ points on the seafloor.
Golden Guarantee
100% Satisfaction Guaranteed or 100% of Your Money Back
We know Surfer and Grapher’s visualization capabilities will help you stand out from the crowd, WOW clients, and leave a lasting impression!
But… we realize you don’t know this yet. And you won’t until you experience our products for yourself.
This is why we provide this guarantee. This is the distillation of a 40+ year adventure designing, developing, and honing powerful visualization and analysis features as requested by scientists and engineers like you.
Our products can produce results far beyond its license fees. We are assuming all your risk, so you have none.


