Tracking Glacier Thickness Changes with Grapher and Surfer
A volunteer effort funded by the Foundation for Glacier and Environmental Research in Seattle is using the Grapher and Surfer packages to visualize changes in ice thickness over time at the massive Juneau Icefield that straddles the Alaska-British Columbia border. The icefield, which contains 24 named glaciers, is an important source of fresh water for northern British Columbia (B.C.).
“The graphs created in Grapher show that glacier thicknesses fluctuate between increasing and decreasing from year-to-year, but the overall trend is thinning,” said Scott McGee, a volunteer Geomatics Program Lead for the Juneau Icefield Research Program (JIRP).

Since 1993, McGee and the JIRP team have spent eight weeks each summer hiking and skiing across the icefield to capture more than a thousand 3D GPS points. Most of their work focuses on the Taku Glacier and its tributary glaciers in the southern half of the overall icefield because these are the primary freshwater feeders for B.C. residents. JIRP seeks to quantify glacier surface elevation changes, and the resultant impact on freshwater discharge into the Yukon River watershed.
The goal each year is to capture new elevation measurements at the same XY locations that were first surveyed nearly 30 years ago on specific longitudinal and transverse transects across the glaciers. Roughly 1200 GPS points are in the JIRP database, but the teams can access only about 1000 for re-surveying in any given summer due to logistics, weather, or dangerous ice conditions. Each new elevation point gives the volunteers a precise measurement of how much the icefield’s thickness has increased or decreased compared to previous years.
“The winter of 2011-2012 was a snowy one in Alaska, and the average thickness of the Juneau Icefield increased by two meters,” said McGee. “But since then, we’ve seen mostly thinning.”
McGee gave up on plotting the elevation profiles in Excel and switched to Grapher years ago because he found the Microsoft application lacked the flexibility and power of the Golden Software product. Specifically, he prefers Grapher because it allows him to control more elements in the graphing process.
“There are more types of graphs offered in Grapher, and you can change every aspect of your graphs, from axes and grid lines to plots and labels. I can make complex, yet understandable graphs in Grapher which just wouldn’t be possible with Excel” McGee said.
He relies on Grapher to plot elevation profiles across specific transects in 2D, often overlaying data from previous years to show change over longer time periods. To illustrate this change more dynamically, McGee often exports Grapher profiles from multiple years into a free application called EZGIF to create dynamic animation sequences showing how the glacier is thinning or thickening along a given transect.
“Animation gives a better sense of movement or change over time,” he said.
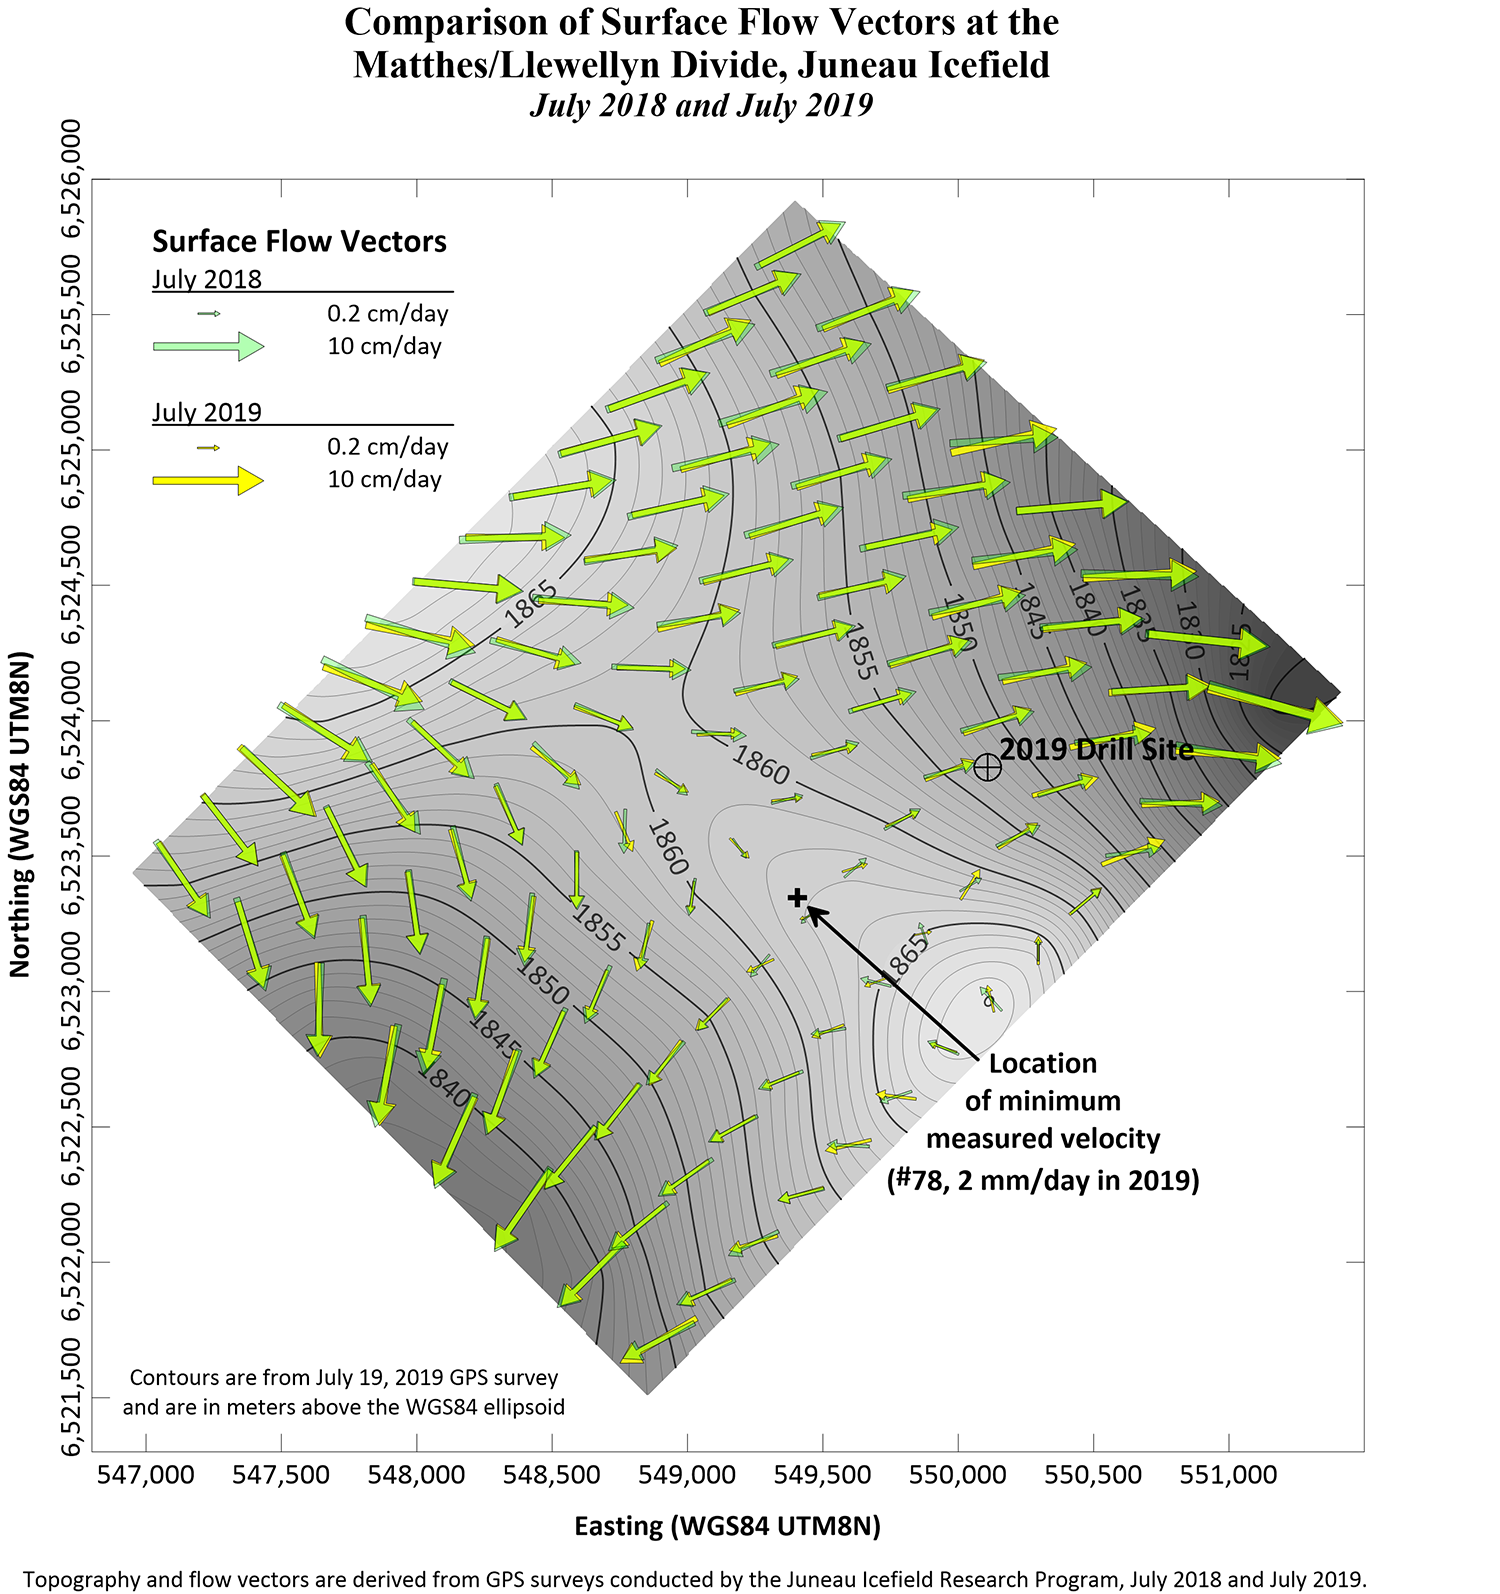
In many cases, McGee inputs GPS points for multiple transects into Surfer to create a 3D map of the glacial surface, providing a more comprehensive view of the overall icefield surface.
“I could [create the 3D surface maps] in ArcGIS, but it would be much more difficult and time consuming,” said McGee. “Surfer is more user friendly for generating surface maps.”
Aside from the trend toward overall thinning of the Juneau Icefield, which was expected, McGee said the primary revelation from the JIRP work has been a greater understanding of how and where the glaciers are changing. Until recently, glacial melt was assumed to occur mostly at the lower elevations of the icefield, where temperatures are generally higher. However, McGee and the JIRP team have routinely discovered thinning occurring at all elevations of the icefield, including at the highest elevations of 1,900 meters.
“Glacial change is a complex process that is highly dependent on annual weather cycles and precipitation,” said McGee. “There is no one answer as to what makes them change and where the change happens.”
For additional information on their work, visit http://crevassezone.org/index.htm.
Golden Guarantee
100% Satisfaction Guaranteed or 100% of Your Money Back
We know Surfer and Grapher’s visualization capabilities will help you stand out from the crowd, WOW clients, and leave a lasting impression!
But… we realize you don’t know this yet. And you won’t until you experience our products for yourself.
This is why we provide this guarantee. This is the distillation of a 40+ year adventure designing, developing, and honing powerful visualization and analysis features as requested by scientists and engineers like you.
Our products can produce results far beyond its license fees. We are assuming all your risk, so you have none.


