Modeling the Changing Landscape at Blackwater Draw
A graduate student at Eastern New Mexico University recreated a portion of the prehistoric landscape at the famous Blackwater Draw Locality 1 Archaeological Site. Jasmine Kidwell’s goal was to better understand climate conditions that may have impacted the Paleo-Indian occupants of this region during the onset of the Younger Dryas, an abrupt return to near-glacial conditions.
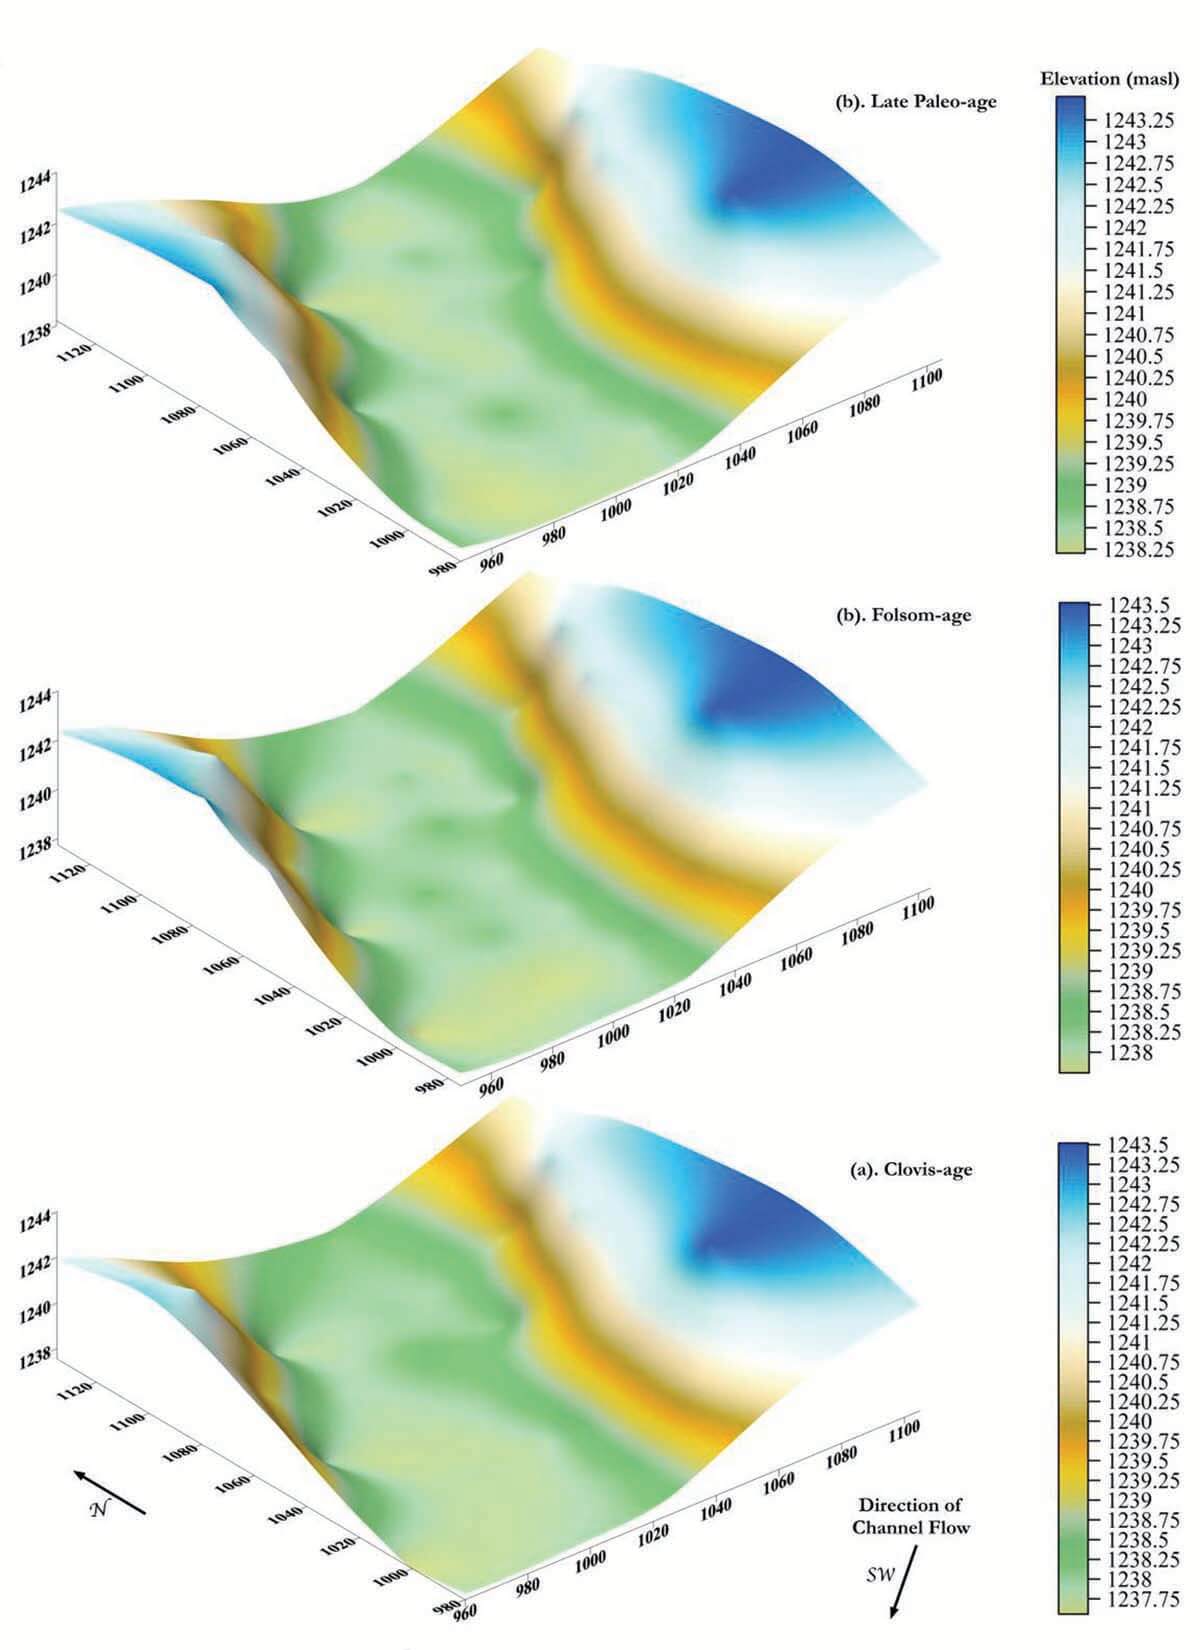
As part of her graduate thesis, Kidwell used Surfer to visualize the subsurface terrain during three cultural periods when Paleo-Indian people occupied the area by mapping core hole deposits.
“As archaeologists, we want to do as minimal amount of invasive destruction as possible,” said Kidwell, explaining that Surfer mapped the buried landscapes in detail that could have only been accomplished otherwise by excavating the site.
This site is known as Blackwater Locality No. 1, the Clovis type-site for North America located near Clovis, N.M., where the first artifacts of the Clovis culture were found in direct association with extinct Pleistocene megafauna. The now well-known Clovis fluted points indicated that people hunted mammoth and other megafauna in the region over 13,000 years ago. But questions linger as to what type of environmental conditions impacted the occupants of this region as the climate fluctuated.
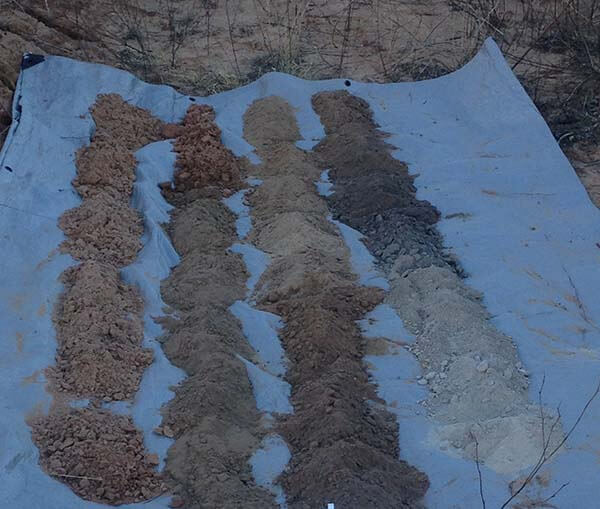
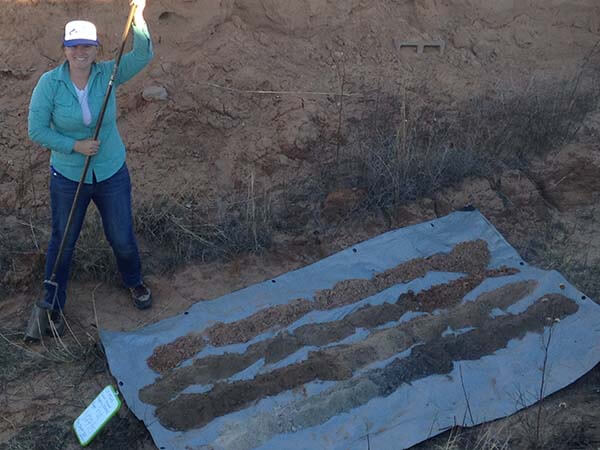
Some archaeologists believe the answer lies in the site’s buried outlet channel, which flowed from a shallow lake into Blackwater Draw proper during the Clovis, Folsom and later Paleo-Indian periods. What caused the ponding of the lake at Blackwater Draw Locality 1 during the onset of the Younger Dryas? That’s the question Kidwell sought to answer by hand-auguring 36 core holes, each reaching five to seven meters below the modern surface to reach the outlet channel deposits from those three periods.
The stratigraphic boundaries were differentiated by sediment color, texture, and content, allowing Kidwell to record X, Y and Z coordinates for the top of each stratigraphic unit in the core holes which spread across the channel. She input the coordinates into Surfer and generated contour maps representing the paleo-landscapes during the Clovis, Folsom and later Paleo-Indian periods to determine how the outlet channel geomorphology evolved over time.
“Archaeologist wonder what may have caused the ponding of the lake and possible blockage within the outlet channel,” said Kidwell.
She explained that some believe the channel may have been blocked by gradual alluvial infilling of sediment or perhaps shifting sand dunes moved into the channel. It’s also possible the channel was blocked by a sill serving as a sediment trap, or even a beaver dam. The potential cause would reflect a different depositional environment and climatic factors contributing to changes in the outlet channel.
“I didn’t find any blockage or accumulation of sediment [in the visualization],” said Kidwell. “What I saw from the surface models and sediments is that the climate may have become increasingly dry over time. The water flow may have decreased.”
This reduction in channel flow that once fed Blackwater Draw occurred throughout the Paleo-Indian occupation and the Younger Dryas, according to the contour maps. Kidwell’s results support the hypothesis that the Younger Dryas brought about increasingly dry conditions at Blackwater Draw Locality 1.
Kidwell learned to use Surfer in a structural geology class, and she said the geomorphologic mapping technique she used where stratigraphic data is derived from core holes is common in archaeology. Surfer is a popular package among archaeologists for this reason.
“Surfer generates such a nice graphic without the need for a secondary program,” said Kidwell. “The contour maps are [colorful] and easy to understand…so that anyone can decipher the topography even if they have no background in geology or archaeology.”
Kidwell is now working on creating an animated sequence in Surfer’s 3D View to show the channel’s changing geomorphology over time for display at the Blackwater Draw National Historic Landmark and Museum.
Golden Guarantee
100% Satisfaction Guaranteed or 100% of Your Money Back
We know Surfer and Grapher’s visualization capabilities will help you stand out from the crowd, WOW clients, and leave a lasting impression!
But… we realize you don’t know this yet. And you won’t until you experience our products for yourself.
This is why we provide this guarantee. This is the distillation of a 40+ year adventure designing, developing, and honing powerful visualization and analysis features as requested by scientists and engineers like you.
Our products can produce results far beyond its license fees. We are assuming all your risk, so you have none.


