Golden Software Expands 3D Subsurface Visualization Capabilities in Latest Surfer Surface Mapping Package
GOLDEN, Colorado, 13 February 2024 – Golden Software has further enhanced the 3D visualization capabilities of its Surfer mapping and 3D visualization software to give users a complete picture of their subsurface data. The expanded visualization tools in the latest Surfer version make it easier than ever to create 3D grid files for the viewing and analysis of drillhole data.
“We built a larger selection of options and greater flexibility into the Surfer visualization functionality with the goal of enabling users to fully exploit their 3D drillhole data,” said Kari Dickenson, Surfer Product Manager. “Surfer users can now gain a more comprehensive understanding of the subsurface environment around their wells and drillholes.”
Over 100,000 people use Surfer worldwide, many are involved in environmental consulting, water resources, engineering, mining, oil & gas exploration, and geospatial projects. The software has been relied upon for more than 40 years by users in numerous disciplines to quickly transform complex data into superior 2D and 3D visuals with accuracy.
Known for its fast and powerful contouring algorithms that regularly outperform more expensive packages, Surfer enables users to model data sets, apply an array of advanced analytics tools, and visually communicate the results in a way that even the non-technical stakeholders can understand.
The new version of Surfer – available now – includes several enhancements:
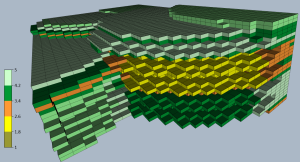
Block Rendering – Users can now render 3D grids as a series of blocks, which can be colorized by a select variable. This is an easy way to calculate and visualize volumes, such as contaminants in a plume.
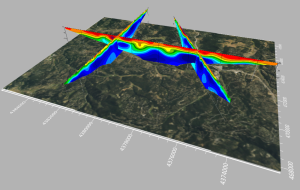
Image Import – Images of cross sections, profiles, and other features can be imported directly into 3D View and oriented in any direction or angle. This makes it easy to create fence diagrams from multiple imported images or display raster logs next to 3D drillholes.
Direct Drillhole Gridding – Users can now import XYZC drillhole data and grid it directly without the additional steps of saving it to an external file. Although the option to save the data in various formats still exists, the direct gridding function saves significant time.
Assigning ‘NoData’ to 3D Grid – To isolate certain features in the 3D grid, users can assign NoData to portions of the grid with a variety of methods: convex hull of the data points, an alpha shape of the data set, a polygon boundary, or above/below a 2D grid surface. This allows users to eliminate unwanted data in a 3D grid outside of field boundaries, well locations, or above (or below) specific surfaces, such as a water table, topography, or lithologic layer.
Surfer Beta Available
As is the tradition, Golden Software has released a Beta version of Surfer simultaneously with the new version to give customers a chance to try out new features and provide feedback while they are still in development. Users may find the Beta version by clicking File | Online from within Surfer.
“In the latest Beta capabilities, we focused on allowing users more options to view and experience their 3D visualizations and also to more readily display their data on top of other maps and images,” said Dickenson.
Here are the new Beta features available now in the latest Surfer release:
Enhanced Base from Server Command – With a click of the mouse, users can connect to a number of online servers to download XYZ Tiles for use as base maps in their Surfer projects. This new XYZ Tile support gives users access to global databases of maps, aerial photographs, satellite images, terrain files, and other data sets.
Upgrades to 3D View
- Copy and Paste Format Properties – An enormous time savings when creating multiple 3D visualizations, users can now copy the properties of an existing visualization in the 3D view and paste all its properties – colors, values, clipping plane – to a second visualization.
- Exporting 3D Vector Files – Users can now easily export 3D geometry to a vector file. Whether a user is drawing a 3D polygon in 2D View or importing 3D geometry from a DXF or shapefile, the geometry can be viewed in the 3D view and then exported to a new vector file as 3D geometry, including AutoCAD DXF or SHP.
- Keyboard Shortcuts for Predefined 3D views – Surfer makes it easy to rotate a 3D model to view it from any side or angle, but getting a view perfectly aligned with precise compass directions using the mouse was tricky. Now, users can rely on keyboard shortcuts to view the model exactly from the top, bottom, north, east, south, or west perspective.
- Orthographic Projection – With a single click, users can switch from the default Perspective projection to an Orthographic projection, which means lines remain straight and orthogonal regardless of distance from the viewer. This makes it much simpler to measure and digitize points in the 3D model.
- Orientation Triad – A new Triad in the corner of the 3D model lets the user know the orientation that they are viewing the model.
- Bounding Box – Developed primarily for including 3D models in reports and presentations, the new function lets users draw a bounding box around their 3D model determined by axes extents (entire model), a volume render, or isosurface.
Golden Guarantee
100% Satisfaction Guaranteed or 100% of Your Money Back
We know Surfer and Grapher’s visualization capabilities will help you stand out from the crowd, WOW clients, and leave a lasting impression!
But… we realize you don’t know this yet. And you won’t until you experience our products for yourself.
This is why we provide this guarantee. This is the distillation of a 40+ year adventure designing, developing, and honing powerful visualization and analysis features as requested by scientists and engineers like you.
Our products can produce results far beyond its license fees. We are assuming all your risk, so you have none.


