Best Practices for Gridding LiDAR Data
Remember when converting randomly spaced data into a uniformly spaced grid used to take hours? You had to manually interpolate data to create contour maps and various visuals, and it wasn’t easy—especially if you had a large dataset. Thankfully, we’re no longer in the early days of geomodeling. Technology has come a long way. These days, you can use advanced gridding algorithms to convert thousands of data points into a grid or raster in little to no time.
In previous blogs, we covered best practices for gridding drillhole data, geophysical data, and concentration data to help you achieve your desired results. But now, it’s time to dive into the best practices for gridding LiDAR data.
Challenges of Gridding LiDAR Data
Let’s set the stage: LiDAR continues to surge in popularity. Back in 2015, a report suggested that the global LiDAR market would hit $944.3 million by 2022, growing at a compound annual growth rate (CAGR) of 17.3%. According to a newer report, the LiDAR market exceeded those expectations, reaching $1.9 billion in 2022 and hitting $2.31 billion in 2023. Fast forward to 2024, and expectations remain high. That same recent report predicts the market will reach $7.94 billion by 2030, with a CAGR of 19.3%. By 2033, another report estimates the market will surge to $8.4 billion.
These numbers aren’t surprising. The geospatial industry—and even tech giants like Apple—have found unique applications for LiDAR data. However, just because something is popular doesn’t mean it’s easy to use, let alone interpolate into a grid for a contour map.
The biggest challenge with gridding LiDAR data is the sheer size of the datasets. LiDAR data often contains tens of millions of points in a single file. Without the right gridding method, you could spend more time than necessary trying to create a grid for a map that impresses decision-makers.
Additionally, because LiDAR datasets are typically massive, your maps could end up with far more detail than necessary. If you don’t have the right filters and parameters to fine-tune your data, you risk overwhelming stakeholders with too much information, diluting the story you’re trying to tell.
3 Best Practices for Gridding LiDAR Data
Here’s the good news: despite the challenges, there are ways to overcome them. When gridding your next LiDAR dataset in Surfer, here are three strategies to save time and achieve the best results.
1. Refine Your Point Cloud Data Using Import Filters
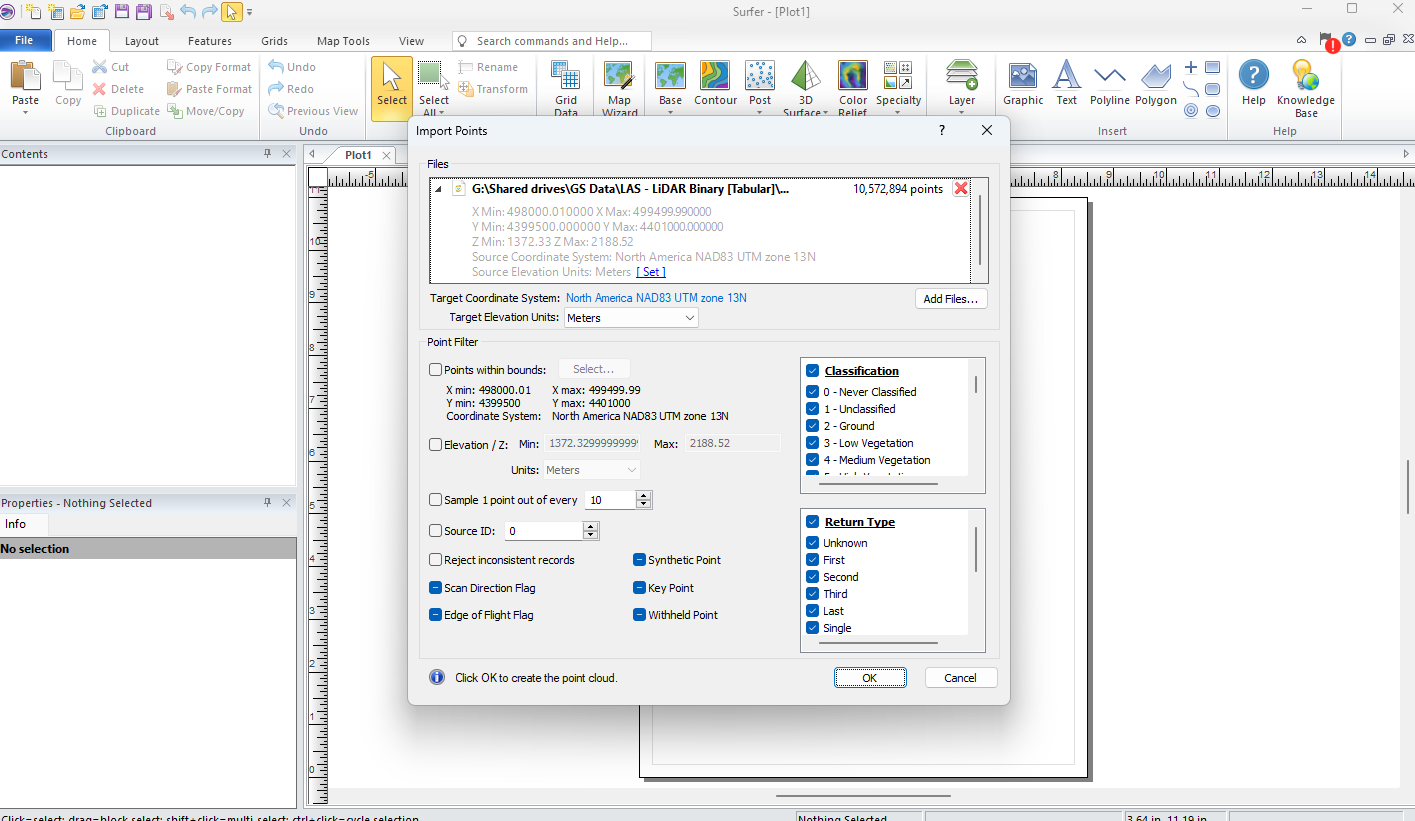
When dealing with millions of points, it’s crucial to focus on the data that matters most to your story. That’s where import filters come into play. Your first step should be to filter your LiDAR data upon import to ensure your grid only accounts for the most critical findings.
For instance, you can adjust elevation values to remove data points in the sky—like clouds, birds, telephone wires, and trees. You can also refine your data by classification to focus solely on low vegetation to high vegetation, buildings, transmission towers, railroads, and more. Filtering by return type is another option if you want to limit your imported points to a specific return value. Additionally, you can specify to import every Nth value, which is particularly helpful if you have an overabundance of data that’s unnecessary for visual display.
2. Select The Right Gridding Method
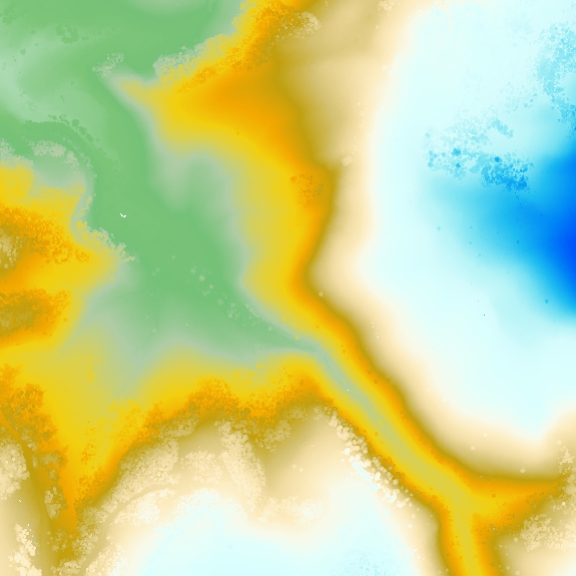
The next step is to create a point cloud layer from your LiDAR dataset, then create a grid from that point cloud layer. This method equips you to create your grid almost immediately—even with a large dataset. That efficiency is hard to match with traditional gridding methods.
For example, let’s say you have a LAS file with ten million data points. You could use a popular method like kriging, known for its flexibility and ability to create visually appealing maps. However, it could take hours to generate your grid with this approach. If you’re pressed for time and need to quickly develop a report, gridding point cloud data using kriging or any other traditional method won’t be efficient.
3. Adjust Your Grid Parameters
There are two primary factors to consider when adjusting your grid parameters: the data field you want to grid and your grid resolution. The first factor is simple—just determine what you want to grid from your point cloud layer. It could be elevation data, intensity, classification, or return number. The second factor requires a little more context and deliberation.
Think of grid resolution as the pixel count in an image. Just as a high-resolution photo captures every tiny detail, a high-resolution grid file will highlight the nuances of your data. Generally speaking, think of low, medium, and high-resolution grids as having around 100, 500, and 1,000+ nodes along their longest edge—each level giving you more detail, just like moving from a thumbnail to a full-sized image.
Now, when you’re picking the perfect grid resolution, it’s all about what you need to see. If every little detail matters, your grid nodes should be as tight as the closest pair of data points; think of it as making sure you don’t miss any whispers in the crowd. But if you’re more interested in the big picture and can afford to let some of those tiny details slide, spacing your nodes based on the average data distance should do the trick.
It’s also important to consider the number of points in your dataset. If you’re importing millions of data points, a lower resolution grid with 1-5 foot spacing might be better. Otherwise, your grid may show so much detail that it detracts from the story you’re telling stakeholders.
Traditional Gridding vs. Specialized Gridding
All the best practices we provided for gridding LiDAR data hinge on you creating a point cloud layer, but that’s not the only way to grid. When using Surfer, you could take the traditional route and simply click “Grid Data” and go from there—but as we briefly mentioned, using traditional methods to grid LiDAR data may not be the best option. To bring that point home, here’s a table showcasing how the traditional method stacks up against specialized best practices.
| Traditional Method: Grid Data | Specialized Method: Grid from a Point Cloud Layer | |
|---|---|---|
| Import Filters | Limited options, such as the following:
|
✅Many options, including the following:
|
| Gridding Options | ✅ Many gridding options | Fewer gridding options |
| Interpolation Algorithm | Various options that are good for all datasets | ✅ One option designed specifically for LiDAR datasets |
| Speed to Create Grid | Slow (sometimes too slow to be a viable option) | ✅ Fast (almost instantaneous) |
| Grid Accuracy | Usually worse | ✅ Usually better |
| Grid Appearance | Usually worse | ✅ Usually better |
Grid Your LiDAR Data Simply & Quickly
Gridding LiDAR data comes with its challenges, but they’re far from insurmountable. With the right gridding method, filters, resolution, and parameters, you can rapidly grid point cloud data to create maps that show exactly what you and your stakeholders need to see. Want to experience this with your next LAS or LAZ file? Download a 14-day free trial of Surfer now.
About Kari

Kari Dickenson is a product manager for one of Golden Software’s signature products, Surfer®. Kari has been with Golden Software since 2000. She grew up in the California Bay Area and received a B.S. in Earth Sciences from the University of California, Santa Cruz. Upon graduating, Kari worked as an intern at Lawrence Livermore National Laboratory, learning more about hydrogeology and performing laboratory experiments and some basic computer modeling on groundwater remediation strategies. She then returned to school at the Colorado School of Mines where she earned a M.S. in Geology, focusing on economic geology. During her graduate program, Kari discovered that she enjoyed helping other students use computers to solve problems. As a product manager at Golden Software, Kari is able to utilize her knowledge of geology with fulfill her desire to solve problems and help users.


