Surfer’s Latest Release is Here—Create Better Maps, Models, & Reports Faster Than Ever
The wait is over—our latest version of Surfer is now available, and it’s packed with new tools to help you create even better maps, models, and reports at a faster pace. Whether you’re working on environmental assessments, resource exploration, or geological modeling, this update was designed with you in mind.
“We know geoscientists need software that’s powerful yet efficient—tools that consistently enhance their workflow so they get more done while still producing high-quality final outputs,” Surfer Product Manager Kari Dickenson said. “That’s why this release focuses on features that streamline their process, reduce manual steps, and improve the quality of their visualizations and reports. With the new enhancements, users can build more accurate, professional-grade maps, models, and reports in less time.”
So, what exactly are these new enhancements in Surfer? Let’s walk through the latest tools and capabilities that are now available and explain how each one will help you work smarter, faster, and more effectively.
Google Maps in XYZ Tiles List: Use Reliable, High-Quality Imagery
When you need a base map to add context to your visualizations, finding the right imagery can be a frustrating challenge. Many online servers lack global coverage, are outdated, or suffer from poor resolution—making it tough to find up-to-date, high-quality imagery, especially in remote areas. And even when a server does have the coverage needed, there’s always the risk that it goes down right when you need it most.
With Surfer’s latest update, these challenges are a thing of the past. Google Maps is now integrated into Surfer’s XYZ Tiles list, joining the OpenStreetMap (OSM) servers already available in the program. This means you get even more access to reliable servers with far-reaching coverage and high-quality satellite imagery. With top-notch global images right at your fingertips, your maps will provide the context needed to communicate key findings more effectively than before.

3D Drillhole Keywords: Label Subsurface Geology
When working with subsurface data, clearly labeling the geology (or any interval data) in your 3D drillholes is essential for conveying insights to stakeholders. Whether you need to highlight stratigraphy, mineralization content, alteration zones, or different formations, making your drillholes visually intuitive is critical—and now it’s easy to do.
Surfer’s new 3D drillhole keywords feature equips you to color-code intervals based on text keywords. All you have to do is include descriptive keywords in your interval table (e.g., “sandstone,” “shale,” “high-grade ore”) and let Surfer handle the rest. The program will automatically apply colors to your 3D drillholes and generate a legend, giving you a clear, professional visualization in just a few clicks.
Need to make adjustments? Editing is also effortless. You can customize colors, reorder keywords, or rename labels to ensure clarity for stakeholders. With this new feature, you can skip any tedious workarounds you may have done in the past and solely focus on delivering meaningful insights about the subsurface.

Contour Slices Through 3D Grids: Showcase Key Details
When visualizing subsurface concentrations, contaminants, or geological formations, a well-built 3D model is invaluable. It has the power to give stakeholders a clear view of what’s happening beneath the surface, especially when all the critical insights are easy to see. But let’s be honest—providing that hasn’t always been straightforward.
That’s where Surfer’s new 3D contour slices through 3D grids come in. With this tool, you can provide decision-makers with the key information they need. This feature lets you add contour slices at any orientation within a 3D grid, giving you a more flexible way to highlight essential details clearly. Whether you need vertical contour slices to track contamination levels, diagonal slices to showcase a geological trend, or a custom plane to highlight hydraulic conductivity while your volume render or isosurface illustrates groundwater contamination, you now have more control over how your subsurface data is displayed.
Better yet, you can fully customize these 3D contour slices using the same intuitive settings available in 2D View. You can adjust labels, set logarithmic contour intervals, or load saved LVL files to match your existing visualization style. Ultimately, the options are endless. By using this new feature, you can now deliver a detailed 3D model that tells stakeholders the full story.
Linked Text: Reduce Errors in Reports
Ever make a mistake when manually updating text in your projects? Maybe it was the date, file name, or content within a specific cell of a worksheet. With Linked Text, those mishaps disappear so your reports are clear and accurate.
This update equips you to dynamically link text objects to specific information, including the date, file name, file path, and the contents of a particular cell in a worksheet. That means when your project updates, your linked text updates, too—automatically. Just click a button, and everything happens instantly. With Linked Text, you get the chance to save time, maintain accuracy, and produce professional, polished reports effortlessly.
Upgrade Your Visuals and Workflow with Surfer’s Latest Release
With the latest version of Surfer, you get new tools to help you create better maps, models, and reports more efficiently. From downloading imagery directly from Google Maps that enhance context and clarity to using 3D drillhole keywords that bring subsurface data to life, these enhancements are designed to make your life easier and ensure you develop professional, high-quality, and accurate final outputs with less effort.
Ready to try these new features to create superior maps, models, and reports quickly? If you’re already a Surfer user, download the latest version now. If you don’t have Surfer yet, download the 14-day free trial to start working faster, smarter, and more effectively with the latest tools!
Recent Articles
- Apr 1, 2026|Gabbie Rhodes|10 min
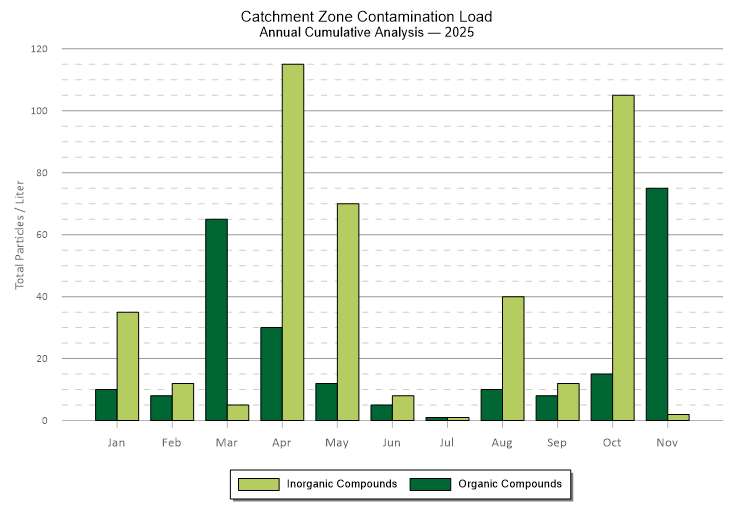
Grouped bar charts offer a distinct and powerful way to compare data. They can bring clarity to differences that might otherwise get buried.
- Apr 1, 2026|Gabbie Rhodes|6 min
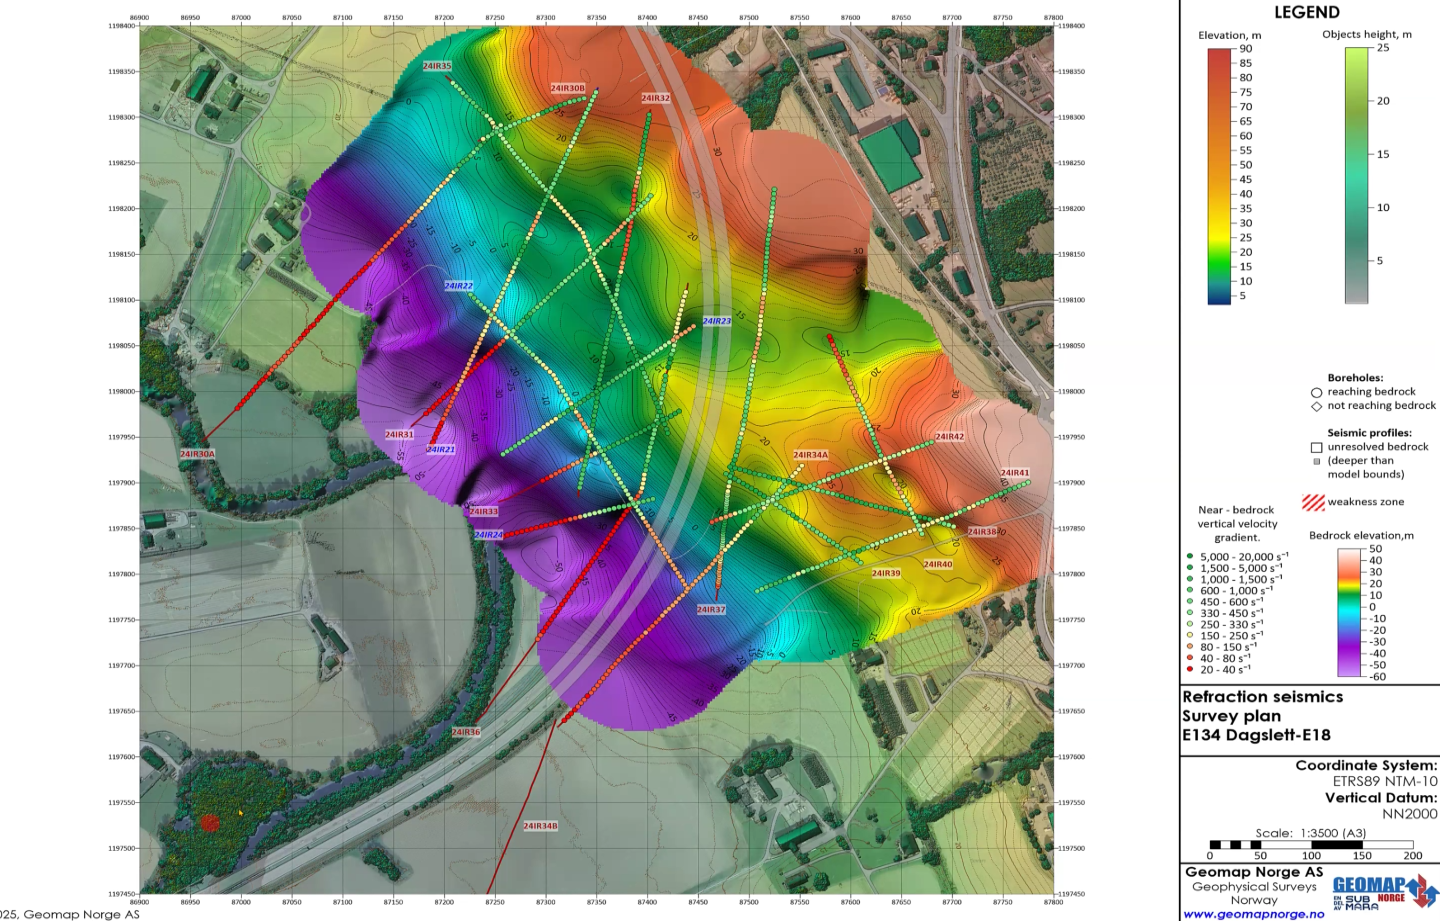
From surface to subsurface features, Alexey Shulgin translates geophysical measurements into clear insight to drive stakeholders' decision-making.
- Mar 25, 2026|Gabbie Rhodes|10 min
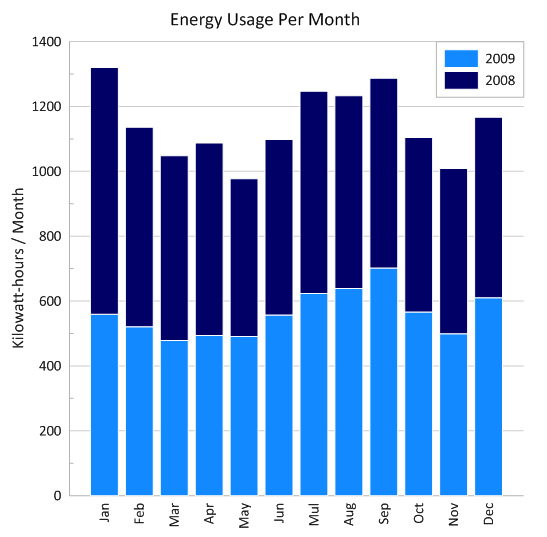
Stacked bar charts are one of those visuals that everyone recognizes but doesn’t always use to their full potential. Discover how to use it effectively.
- Mar 25, 2026|Gabbie Rhodes|11 min
One of the most common choices in scientific data visualization is deciding between a log scale vs. linear scale. Here's how to choose wisely.