What Should You Do With Data In Different Coordinate Systems?
When creating a map for stakeholders, clarity and accuracy are essential. Without them, confusion creeps in, decisions lose momentum, and engagement dwindles. The challenge? Achieving that clarity and accuracy when your data comes from different coordinate systems.
Maybe you’ve encountered this issue with your data visualization software, leading you to search community forums and help sections for solutions. Or perhaps you’re shopping for new visualization software and need assurance it can handle mixed coordinate systems before you commit. Either way, you’re in the right place. This article will walk you through how to create clear, accurate maps when working with data from different coordinate systems.
- Coordinate Systems: What Are They?
- What is a Geographic Coordinate System?
- What is a Projected Coordinate System?
- What is an Unreferenced Coordinate System?
- Why Are There So Many Coordinate Systems?
- Modern Tech Helping Collect Location Data
- Is it Common to Have Data from Different Coordinate Systems?
- How to Map Data from Different Coordinates
- When Should You Set a Coordinate System?
- It’s Easier Than You Think
Coordinate Systems: What Are They?
Let’s start with the basics. What exactly are coordinate systems? In simple terms, coordinate systems are the foundation of spatial data, giving you a standardized framework to pinpoint, measure, and represent locations on Earth’s surface. There are various types of coordinate systems, but each one has a reference point (origin), coordinate axes (latitude/longitude or easting/northing), and units of measurement (degrees, meters, feet, etc.).
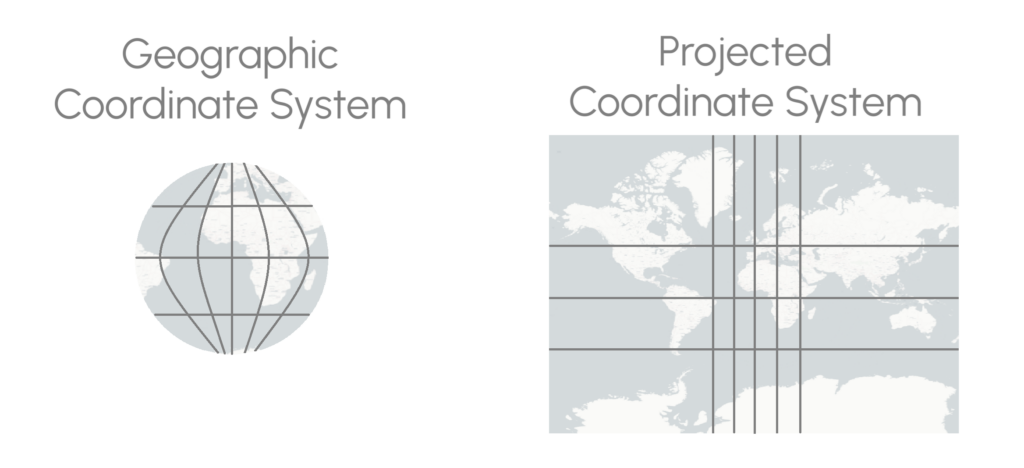
Among the many coordinate systems available, three common types stand out: geographic, projected, and unreferenced. Each one is beneficial in its own right and helps address unique needs for mapping and spatial analysis, so it’s important to know the ins and outs of these three options.
What is a Geographic Coordinate System?
A geographic coordinate system is like Earth’s very own address book, using latitude and longitude to specify exact locations. Anchored by the equator (for latitude) and Prime Meridian (for longitude), this 3D system measures coordinates in degrees, minutes, and seconds (or decimal degrees) to tell you exactly where something sits on the globe.
A prime example of a geographic coordinate system is the World Geodetic System (WGS) 1984, which is widely used for mapping and navigation. It delivers latitude and longitude coordinates with pinpoint precision by modeling Earth’s shape as an ellipsoid, providing a reliable framework for GPS, geographic information systems, and more.
What is a Projected Coordinate System?
Next up: projected coordinate systems. This one is designed to flatten Earth’s 3D curves into a 2D, map-friendly layout. With projected coordinate systems, you can turn geographic data into XY coordinates so you can accurately visualize spatial data on a flat surface—making it perfect for everything from regional maps to city planning. There are several well-known projected coordinate systems you’ll come across. Below is a look at three popular ones.
1. Universal Transverse Mercator Coordinate System
The Universal Transverse Mercator (UTM) coordinate system is a grid-based approach to pinpoint locations on Earth. It divides the globe into 60 zones, each 6 degrees wide in longitude, numbered 1 through 60, starting at the 180-degree meridian and moving east. This setup is based on the Transverse Mercator projection, which aligns a cylindrical projection along a central meridian rather than the equator. This orientation minimizes distortion for regions that are more north-south in shape, making it especially useful for mapping areas like national borders and topographic landscapes.
2. State Plane Coordinate System
The State Plane Coordinate System is a U.S.-only coordinate system that divides each state into zones to achieve spot-on accuracy. With this method, each state gets between one and six zones, depending on its size and shape, and these zones often follow county lines (Alaska being the exception). For instance, sprawling states like Colorado split into zones, such as “Colorado North,” for even more precision.
Here’s where it gets interesting: zones adapt to the layout of each state. States with a north-south orientation, like Illinois, use a Transverse Mercator projection, while those stretching east-west, like Pennsylvania, use a Lambert Conformal projection. To minimize distortion, each projection’s central meridian is run through the heart of its zone, ensuring that State Plane Coordinate System maps offer clear, accurate depictions across the U.S.
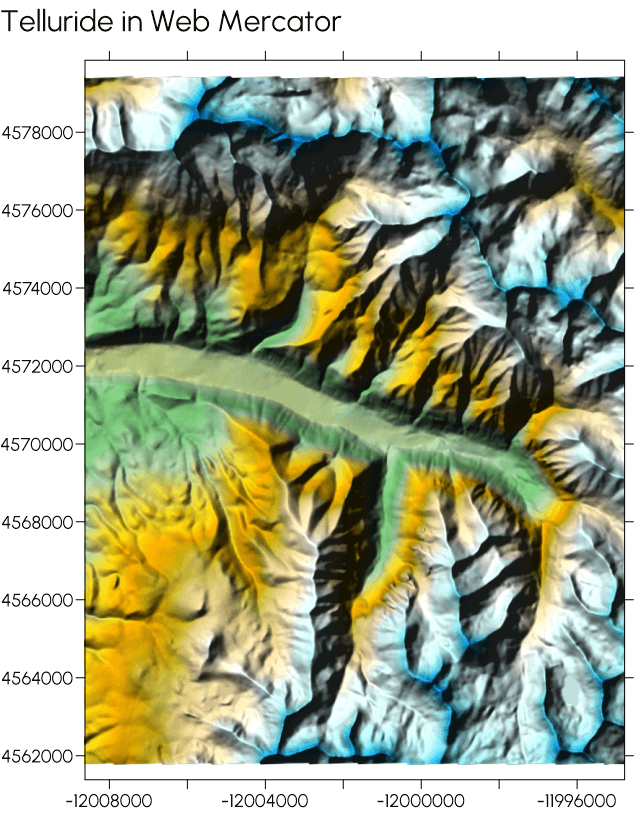
3. Web Mercator Coordinate System
The Web Mercator is the projected coordinate system behind most web mapping tools like Google Maps and Bing Maps. Also referred to as Google Web Mercator, WGS 84 Web Mercator, Spherical Mercator, and Pseudo-Mercator, this coordinate system a meter-based projection covering most of the world, excluding the polar regions (from latitudes -85 to 85), making it the standard for online maps.
With Web Mercator, coordinates defined on the WGS 84 ellipsoid are projected as if they were on a sphere with a radius of 6378137.0 meters (matching WGS 1984’s semi-major axis). This creates a convenient, web-friendly map but introduces scale distortions, particularly far from the equator, and doesn’t preserve straight-line rhumb lines.
What is an Unreferenced Coordinate System?
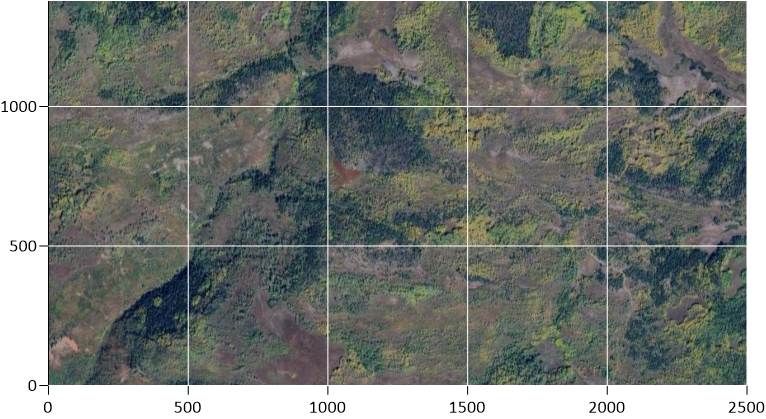
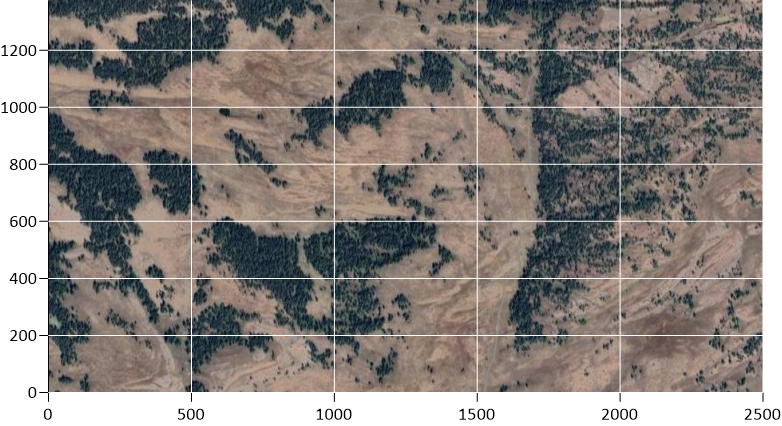
Finally, let’s talk about unreferenced coordinate systems. This approach to spatial referencing isn’t tied to a known geographic reference system. Instead, it operates from an arbitrary origin point, with coordinates increasing uniformly in the X and Y directions. For example, say you have a SHP file but don’t have a PRJ file or any projection information. In this case, you can still create a map using your data, but it’d simply be in an unreferenced coordinate system.
Another thing to keep in mind is that an unreferenced coordinate system is flexible when it comes to units of measurement, giving you freedom to specify them as needed—whether in millimeters, feet, miles, or even units that remain undefined. This system shines in situations where you’re using a local coordinate system that isn’t based on a predefined geographic projection and datum. It’s especially handy for engineering projects, localized site surveys, or integrating data from sources that don’t share a common spatial reference.
By leveraging an unreferenced coordinate system, you can efficiently manage and analyze spatial data without the restrictions imposed by geographic or projected systems. With this type, it’s all about giving you the freedom to focus on what’s relevant, without getting bogged down by unnecessary geospatial constraints.
Why Are There So Many Coordinate Systems?
At this point, you can probably tell that geographic, projected, and unreferenced coordinate systems have a lot to offer, including their own types of coordinate systems in some cases. The question now is this: why do all these coordinate systems exist?
Simply put, the abundance of coordinate systems exists to tackle the challenges of mapping a planet that isn’t a perfect sphere. Factors like the Earth’s uneven shape, continental drift, and varying topographies mean that no single coordinate system can provide accurate mapping for every region. That’s why you can select from various coordinate systems based on your specific location and project needs, ensuring you capture the most precise location data for your maps.
Modern Tech Helping Collect Location Data
Now, how exactly do you capture precise location data for your maps? Today, there are various advanced technologies that can collect data using whatever coordinate system you choose. However, the most innovative solutions are the following:
- Remote Sensing: With remote sensing, you can gather intel on Earth’s surface from miles away—like taking a bird’s-eye view to the next level. By mounting sensors on planes or satellites, remote sensing captures images, elevation data, and even environmental changes, offering a powerful way to monitor and map the planet.
- Global Positioning System (GPS): Think of GPS as a high-tech compass powered by a fleet of satellites orbiting the Earth. GPS zeroes in on exact spots, making it a go-to tool for location data collection, mapping, navigation, and tracking.
- Light Detection and Ranging (LiDAR): LiDAR takes location data to new heights by shooting lasers to measure distances, creating strikingly detailed 3D models of landscapes. It’s a favorite for crafting digital elevation models and mapping terrain, as it delivers a highly accurate, laser-crafted look at Earth’s surface.
With these cutting-edge technologies, it’s easier to collect precise and detailed location data. The only hangup is that the data you’ve gathered may not be in the same coordinate system.
Is it Common to Have Data from Different Coordinate Systems?
It’s incredibly common to have data from different coordinate systems, especially if you’re collecting insights from different sources. Think about it — say you downloaded data from the USGS, and it’s in the WGS 1984 geographic coordinate system. A few days later, maybe you’ll collect field data using the State Plane Coordinate System. In this case, when it’s time to build a clear, accurate map using the USGS data and your field data, you’ll have information from different coordinate systems. The good news? It’s not hard to create a highly accurate map in this situation.
How to Map Data from Different Coordinates
Advanced data visualization software makes it easy to handle information from different coordinate systems. With Surfer, for example, you can effortlessly input data from different coordinate systems and convert everything into a unified system right within the program—no need for extra software or mathematical calculations on your end. This seamless process saves both time and effort, equipping you to jump straight into the other parts of your design process.
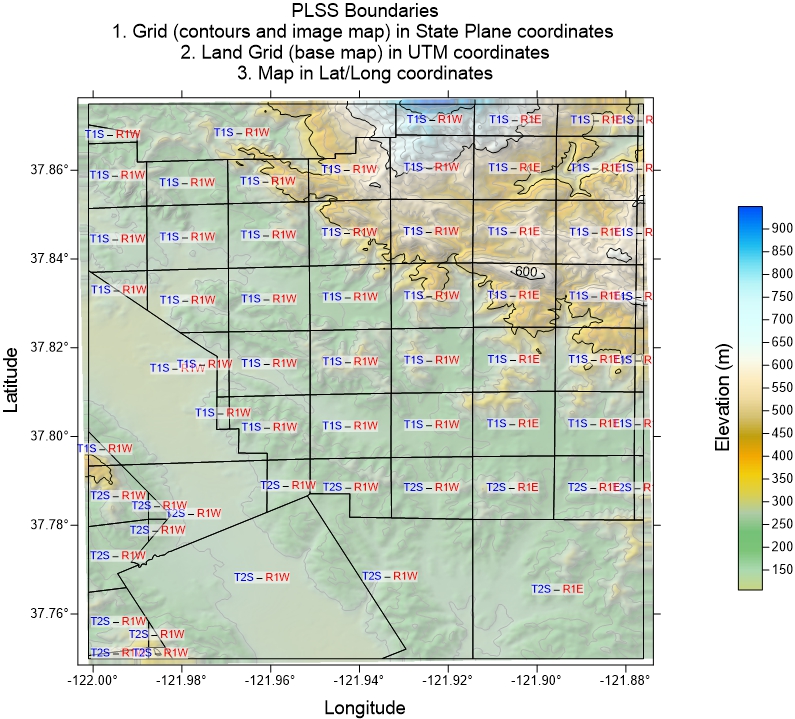
For example, you can build a contour map from a grid file in State Plane coordinates, add a layer of data points in Lat/Lon, and display it all in the coordinate system that best fits your needs before adding other design elements to make your map compelling for stakeholders. It’s that easy. Here are the step-by-step instructions to prove it.
When Should You Set a Coordinate System?
Since we’re discussing coordinate systems, it’s also worth noting that you don’t always need to use a coordinate system for your map. At least, that’s the case with Surfer (as other tools do actually require you to choose a coordinate system before seeing your map). But in our case, you can just upload an unreferenced shapefile and view your visualization.
The only times you’d need to assign a coordinate system in Surfer is when you’re in one of these situations:
- You’re loading data in one coordinate system (like State Plane 1983 – South Carolina) but want to display the map in another (like Lat/Lon).
- You’re creating a map with layers from data in different coordinate systems (such as one shapefile in State Plane, another in UTM, and another in Lat/Lon) to ensure they overlay correctly.
- You want to download a base map from a server like WMS or Google Maps and get a good result.
- You want to export your map to a file type (like SHP or GeoTIFF) and keep the coordinate system information with the exported file.
Here’s the bottom line: if all layers share the same coordinate system, you’re not switching the map’s coordinate system, not downloading a base map, and don’t need reference information when exporting, then setting a coordinate system isn’t necessary.
It’s Easier Than You Think
When you have data from different coordinate systems, you can still create a clear, accurate map that makes sense and engages stakeholders. This is especially true when you’re using the right software. Want to experience this for yourself? Download a 14-day free trial of Surfer to design a stunning, precise map, regardless of your data’s coordinate systems.
