Equalize Data to Resolve Uneven Distribution
Many datasets are not linearly distributed – take the Golden.GRD file located in the Surfer Samples directory, for example. This topographic grid file has a skewed normal distribution with some outlier Z values that are 1000 feet from the bulk of the data. Therefore, if you set contour intervals for this grid file to a regular increment, many of the features in the topographic map are difficult to resolve. So let’s look at tools with Surfer that can assist you in quickly creating an insightful contour map from this data.
Equalize Contours with Level Methods
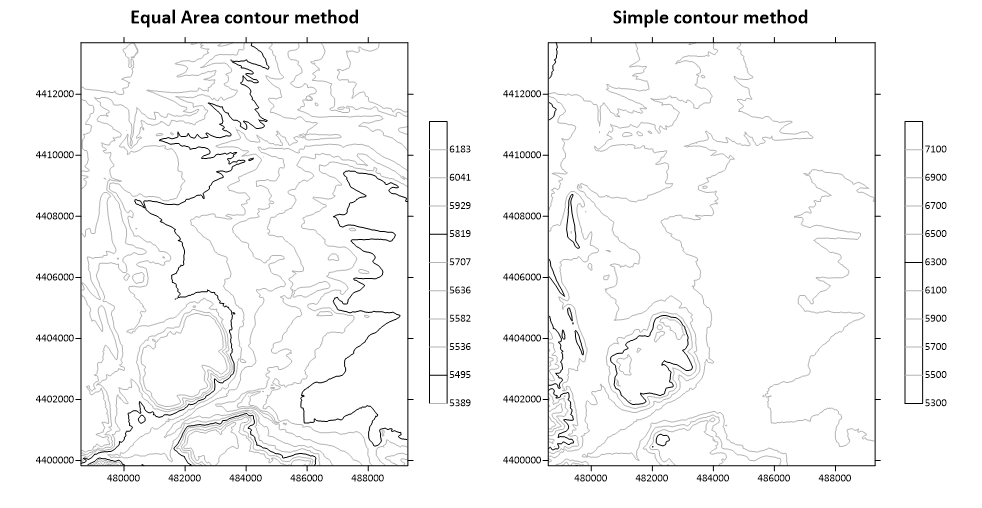
The Equal Area Level method for contour maps in Surfer will automatically calculate contour levels so that there are an equal number of grid nodes (equal map area) within each contour interval. Choosing this option will ensure that your contour lines are more evenly distributed across flatter topographic areas, rather than being clustered in areas of steep gradient. Let’s take a look at the difference below.
These two maps have the same number of contour intervals. In the Simple contour map, most of the contour lines are clustered around the areas of steepest gradient change – the foothills of Golden, Colorado. Details in the flatter topography to the east are lost. In the Equal Area contour map, contour lines are distributed across the area more evenly, so we can really see those smaller variations in topography towards the east of the map.
Equalize Color Schemes with Stretching
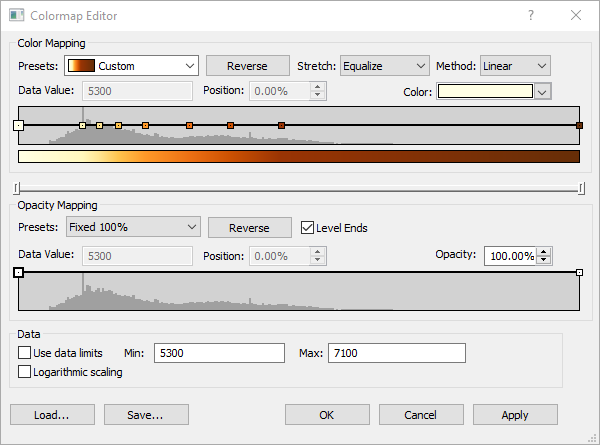
Now we can add some color fill to our contour maps. Long time Surfer users have probably noticed one of our favorite new features, the greatly improved Colormap Editor. This is a huge step up from the previous version (as many of you have told us!) and we want to share a tip that will give your Equal Area contour maps far greater visual impact. The Equalize stretch method positions the color mapping nodes equally based on the data distribution in the shown histogram. You can think of this as the color fill equivalent to creating Equal Area contour intervals.
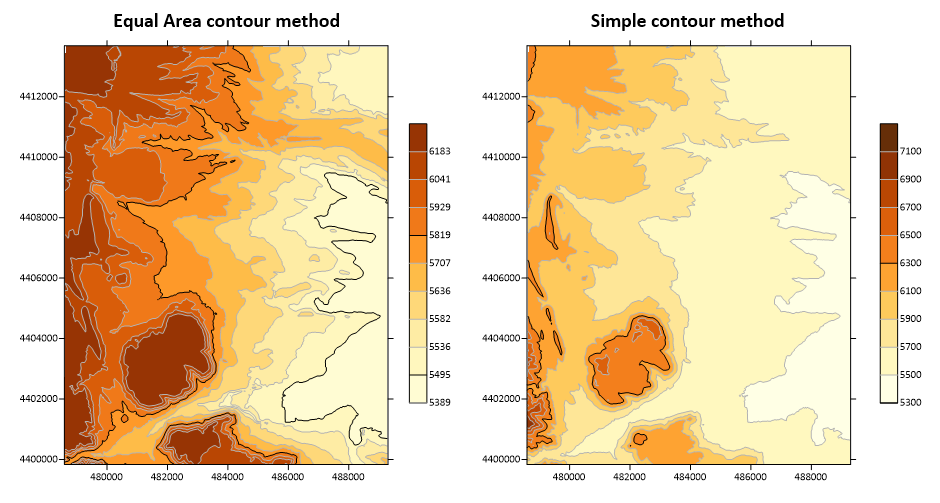
When we combine the Equal Area contour levels with the Equalize color stretch, the visual effect is much more pronounced. Same grid, very different outcomes! This workflow is particularly suited to geophsysical data, such as that collected during magnetic or gravity surveys. These readings often represent a very wide range of values, yet the bulk of the data is typically found within a short range of values. Sometimes highlighting small variations in the background data is required, and equalization makes this task easy to achieve – even with the presence of large local anomalies.
Active maintenance users receive these new features for free. Simply download and install the latest version and you’re good to go. If your maintenance has expired, simply renew your maintenance to gain access to Surfer today. Instructions for renewing maintenance can be found here: How do I renew my software maintenance? For anyone else wishing to experience the new equalize features, download the two-week Surfer trial today.
