Unlock New Levels of Efficiency With the Latest Version of Grapher
The goal of using any data visualization software is simple: design compelling visuals quickly and easily. When you’re an engineer or scientist, this isn’t just a goal—it’s a non-negotiable. You’re juggling complex problems, crunching mountains of data, and the last thing you need is a software that drags its feet. With time always ticking, you need a tool that makes data visualization fast and simple.
Enter Grapher. It simplifies the process of turning complex data into stunning graphical representations, freeing you up to focus on what matters most. And now, with the latest release of Grapher, you can create captivating graphs faster and easier than before. Say hello to a new level of efficiency.
“In the new release of Grapher, we have continued to build on our recent usability survey, with the goal of streamlining the interface and functionality so that users become more productive,” said Santiago Vivas, Grapher Product Manager. “New users will also find Grapher is faster and easier to learn.”
Time-Saving Features You Need
When you install and open the new version of Grapher, you’ll find several enhancements. Some are subtle, some are significant, but all of them work together to save you time and make your workflow smoother. If you’re a subscriber or have active maintenance on your license, here’s what you can look forward to:
- New features to enhance your workflow
- Usability improvements to simplify your visualization process
- Discoverability improvements so you can easily find and use the right tools
This trio of enhancements ensures you can quickly transform complex data into compelling, easy-to-understand graphs with less effort and fewer clicks. Curious about how they work? Let’s dive into each one.
Top New Features
Grapher has three new features, each inspired by customer feedback. Here’s what’s new:
- Better Plot Document & Page Management: In Grapher, each project is its own page. But sometimes, you’ve got a story to tell that needs more than one page. With the new version of Grapher, you can easily combine old projects into a single project with multiple pages. Just a few clicks, and boom. You’ve got a comprehensive, multi-page project.
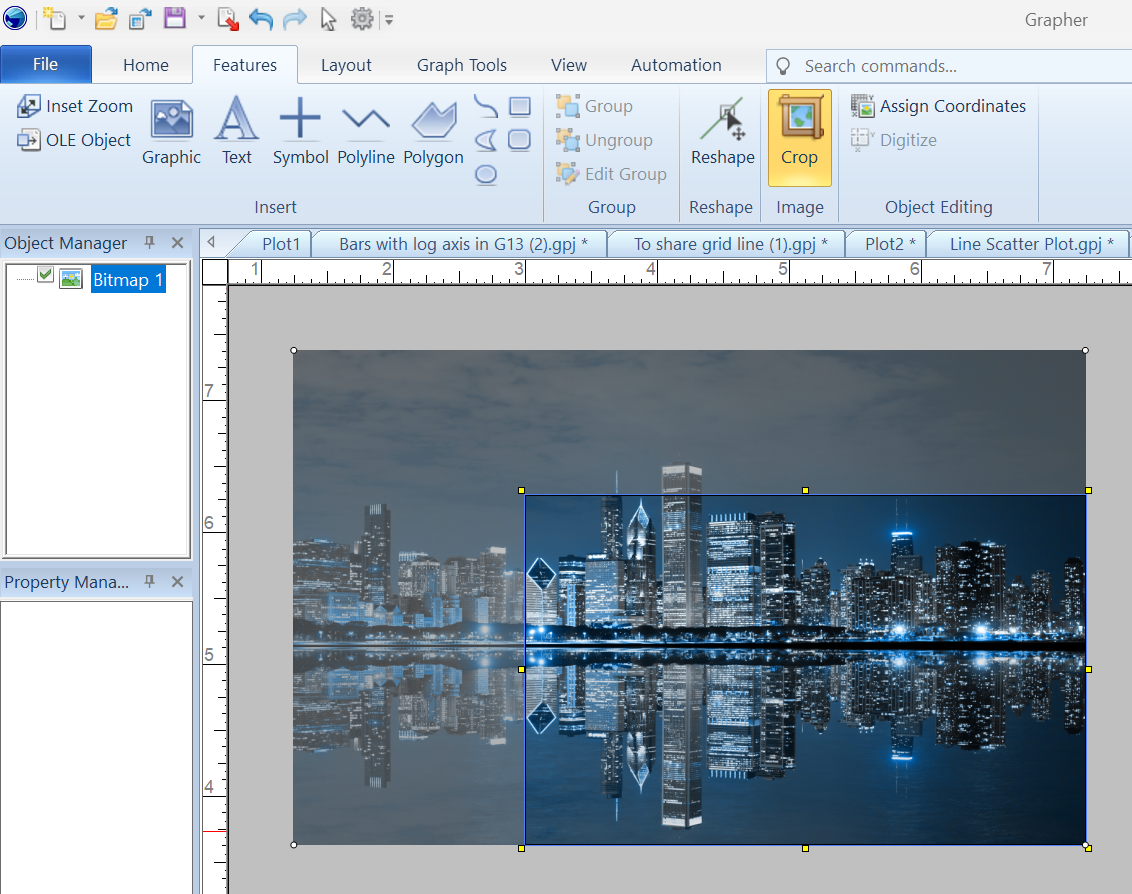
- Image Cropping: Ever tried cropping images in another program and wished you could do it right in Grapher? Now you can. The new image cropping feature lets you trim images, so they fit snugly alongside your graphs—no extra software required.
- File | Save All: You know the drill. One minute, you have a tab open. Next, you’re drowning in a sea of browser tabs. Rather than saving each one individually, the new Save All feature lets you save everything at once. No frills, no fuss, just pure efficiency.
With these tools, you’ll save precious seconds (maybe even minutes) in your design process, so you can get back to doing what you do best: solving the world’s complex problems.
Usability Improvements
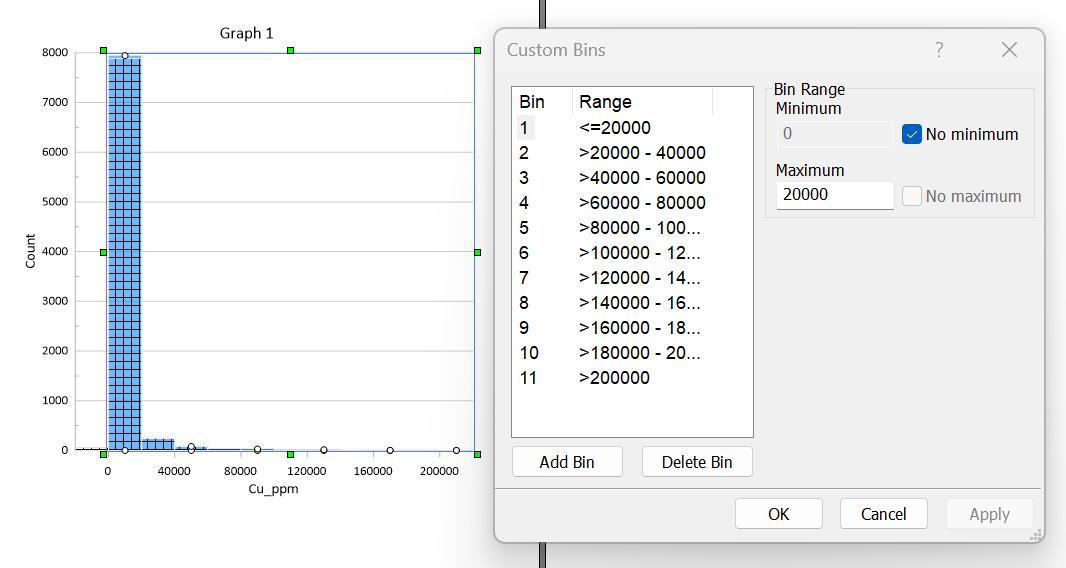
One of the biggest improvements in Grapher? You can customize bins more efficiently in histograms. Previously, even minor tweaks required starting from scratch. Now, with auto-generated bins as your starting point, you can make adjustments without the do-over, speeding up your visualization process.
Discoverability Improvements
To ensure every click in Grapher leads to the tool you have in mind, we’re always enhancing discoverability. In the latest version of Grapher, we’ve made it easier to find exactly what you need, right when you need it. Here are the main improvements:
- Gradient Properties: These were previously hidden in a spot you may not consider looking. Now, Gradient Properties are front and center in the Plot Fill Properties menu.
- Text Editor: Deciphering the uppercase sigma symbol (Σ) wasn’t always intuitive. So, we’ve added a text editor icon to eliminate guesswork and help you tweak your text quickly.
- Add Plot Options: Understanding how to add plots to create multi-plot graphs wasn’t crystal clear. But now, there’s a new button in the Object Manager that even changes color when you hover over it, ensuring it’s obvious where and how to add plots.
With these discoverability improvements, every button you press will be right on target. That means no more second guessing the location of certain tools. It’s just a straight shot to what you need. Bullseye.
2D and 3D Graphing Made Fast and Simple
If you want to transform your complex data into stunning 2D and 3D graphs, the newest version of Grapher is your solution. Say goodbye to unnecessary clicks that add a few minutes to your workflow, and make way for extra ease and time savings.
To start using the new features in Grapher, open the program and click File | Online | Check for Update.
Not using Grapher yet? Download the 14-day free trial and see for yourself how these improvements can quicken your graphing workflow.
