New 3D Customization Options in the Latest Surfer Release
Last week an update of Surfer and Surfer Beta was released! The release features some great new 2D and 3D customization options. As well as some highly requested new workflows such as the ability to digitize coordinates in the 3D view and ability to export grids to a GeoTIFF with the actual Z coordinates. Read below for a more in depth look at the top new features added in this latest Surfer release!
Improved 3D Customization Options for Surface Maps
New methods have been added to show the base on 3D surface layers. You can now select three different Z value settings to define to what Z value the base is shown. Previously, the base for the 3D surface layer filled the sides from the surface down to the minimum Z value of the grid file. Now you can select to show the base from the surface down to the minimum Z value in the map, to the minimum Z value in the grid, or to any Z value that you specify.
3D Digitization
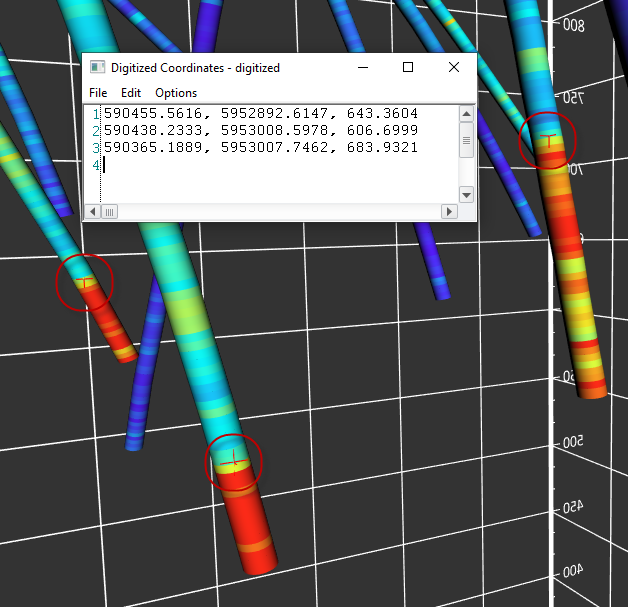
Before this new release, you could digitize your XY coordinates in 2D maps. Many of you use this feature to create blanking data. You can now perform the same type of digitization of data in the 3D view. 3D digitization collects XY and Z coordinates. Although you can use this new feature in a variety of functions, one function could be to obtain the XYZ coordinates of specific spot locations on a surface or points on subsurface drillhole paths.
This new feature works well with our new drillhole map. For example, when viewed in 3D, you can digitize specific locations at depth on each drillhole (e.g. the top of a unit or stratigraphic layer, determined by your displayed drillhole data). You can then go back to the 2D plot view, grid the digitized XYZ data, and add a contour layer from grid file to the existing drillhole map. The new surface will also be displayed in the 3D view with the drillhole paths!
New Frames for Color and Map Scale Bars
We have added two important enhancements to the visual appeal and aesthetics of maps that you need to present to clients or peers. You can now add and customize a frame around color scale bars and map scale bars. You can set the margin between the frame and text in the scale bars and you can define its fill and line properties. This is very useful when overlaying the color or map scale bar on top of a filled map, such as an aerial photograph.
More Help with Color Scale Bars
We know that many of you often build maps that have several layers and thus have several color scale bars. A new enhancement makes it easy for you to identify which layer a color scale bar belongs to. In the Contents window, click on one of the color scales and the name of the layer it is linked to is displayed in the Properties window.
Manage Warning Message Default Behavior
Because of Surfer’s flexibility, the application warns you when changes you make to maps may create unintended consequences. For example, Surfer issues a warning when adding new layers to maps when the added layers have data outside the current map limits. You are asked if you would like to adjust the map limits to include all the data, or keep the limits as they are. These warnings give you the option of cancelling out of the change or accepting the change and continuing.
Some of you perform routine tasks that trigger these types of warnings repeatedly, always with the same response. To save you time and headache, we have made several of these warnings optional. You can either choose not to show the warnings in the future directly in the warning itself, or you can use the File | Options command and control whether to display the warnings or not, or specify the default action to take.
Save a Grid as a GeoTIFF
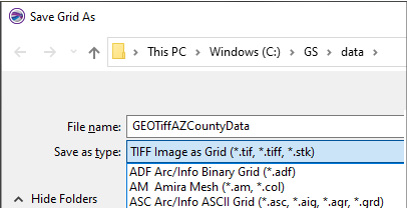
You could always export a map as an image TIFF, but now you can save a grid in GeoTIFF format, so that the Z values are saved to the TIFF file instead of colors for an image. Anywhere you can save a grid, you can select to save it in the TIFF Image as Grid format.
Map Wizard Enhancements
The Map Wizard has some new wizardry! We have added Point Cloud and Peaks and Depressions maps to the available map types you can create. These enhancements work the same way as creating other map types from the Map Wizard, simply select the Home | Wizard | Map Wizard command, select your data or grid file and click Next. Select the map types you want to create! Note that you can only select Point Cloud map type if you selected a LiDAR LAS or LAZ file in the previous step, and then selected to load it as a point cloud.
Quick Access to Grid Info
We created a quick way to access commonly used grid information, by including this information on the Info property page for any grid-based layer. These new Info page contains information about a grid file itself, its XY geometry, and some Z statistical information.
The Info properties page is a quick way to see information for any grid in the plot window or the active grid in the Grid Editor. Simply click on a grid layer and select the Info properties page to view the information. You can even click the Copy button to copy and then paste this information into the plot window, or another application.
We hope you enjoy the latest Surfer update! If you haven’t already updated to the latest version any active maintenance user can do so by clicking File | Online | Check for update. If you aren’t an active maintenance customer you can renew here: Renew Software Maintenance


