Found a 3D Model That Inspires You? Here’s How to Re-Create & Present It
When you work in data visualization, you see it all—2D maps, 3D models, and occasionally, some visualizations that serve as cautionary tales rather than inspiration. But when a visual really grabs your attention, it does more than just look good; it sparks ideas for what you’d love to create for your stakeholders. The challenge? Figuring out how to transform that inspiration into reality with your own data.
Where the Real Challenge Lies
Recreating a 2D map you’ve admired is often straightforward. These classic visualizations—like contour maps or color relief maps—follow familiar workflows. With a bit of practice and the right tools, you can usually replicate them with little guesswork. But 3D models? That’s where things get interesting.
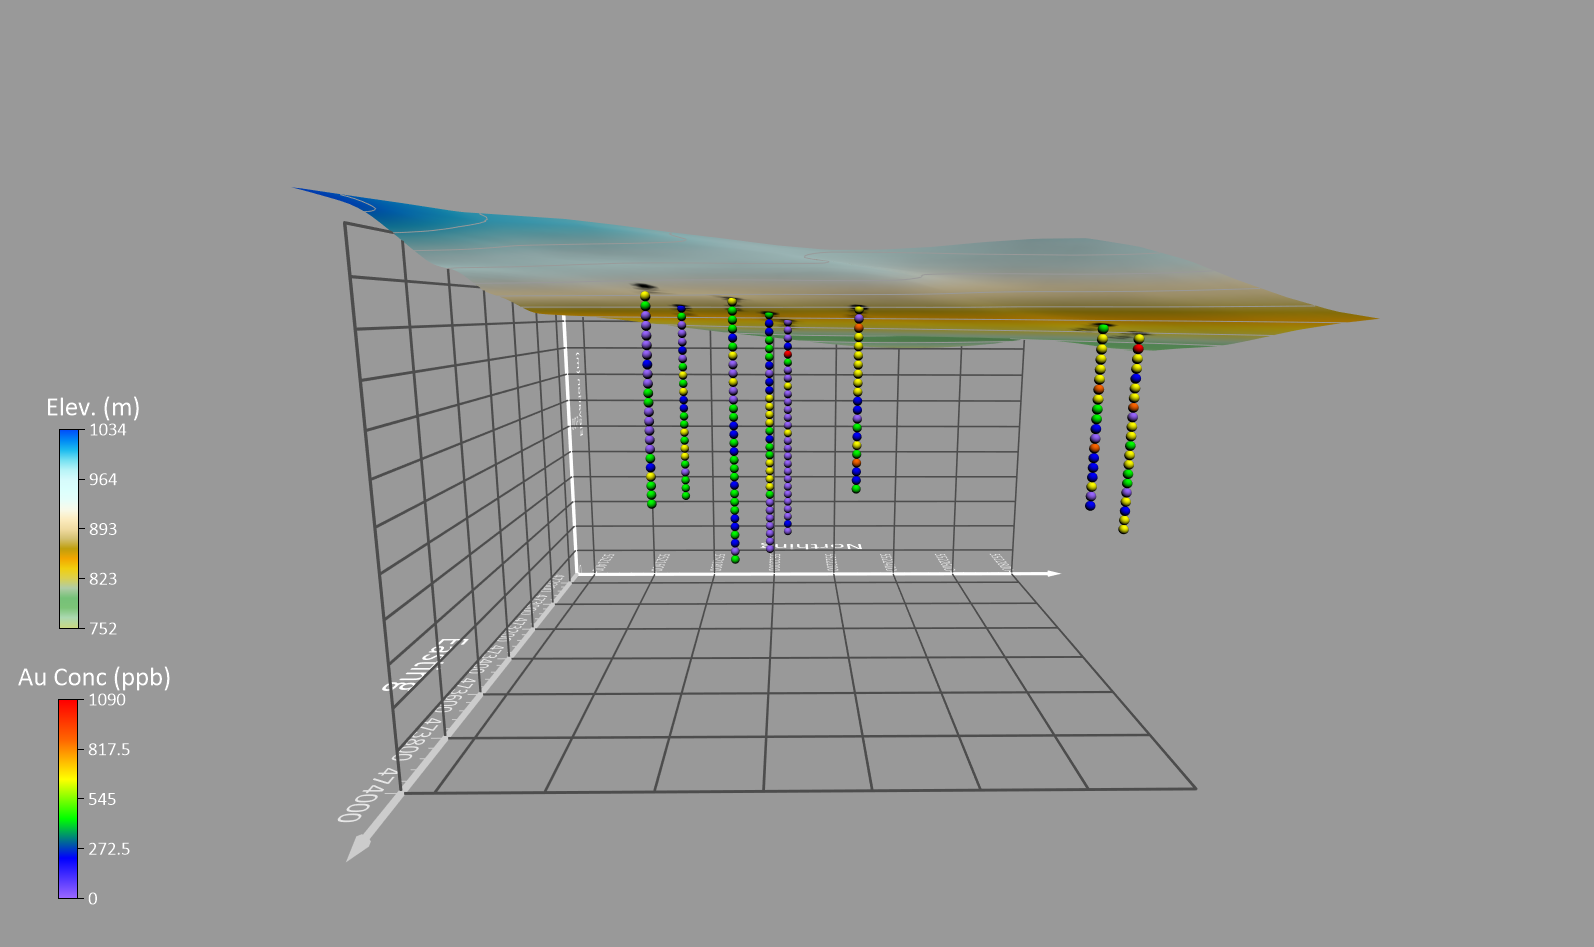
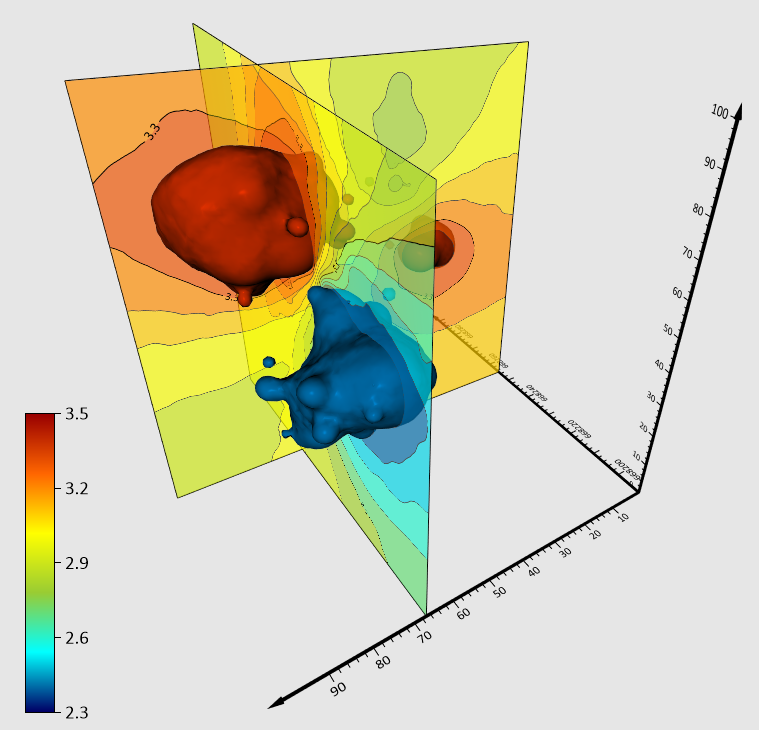
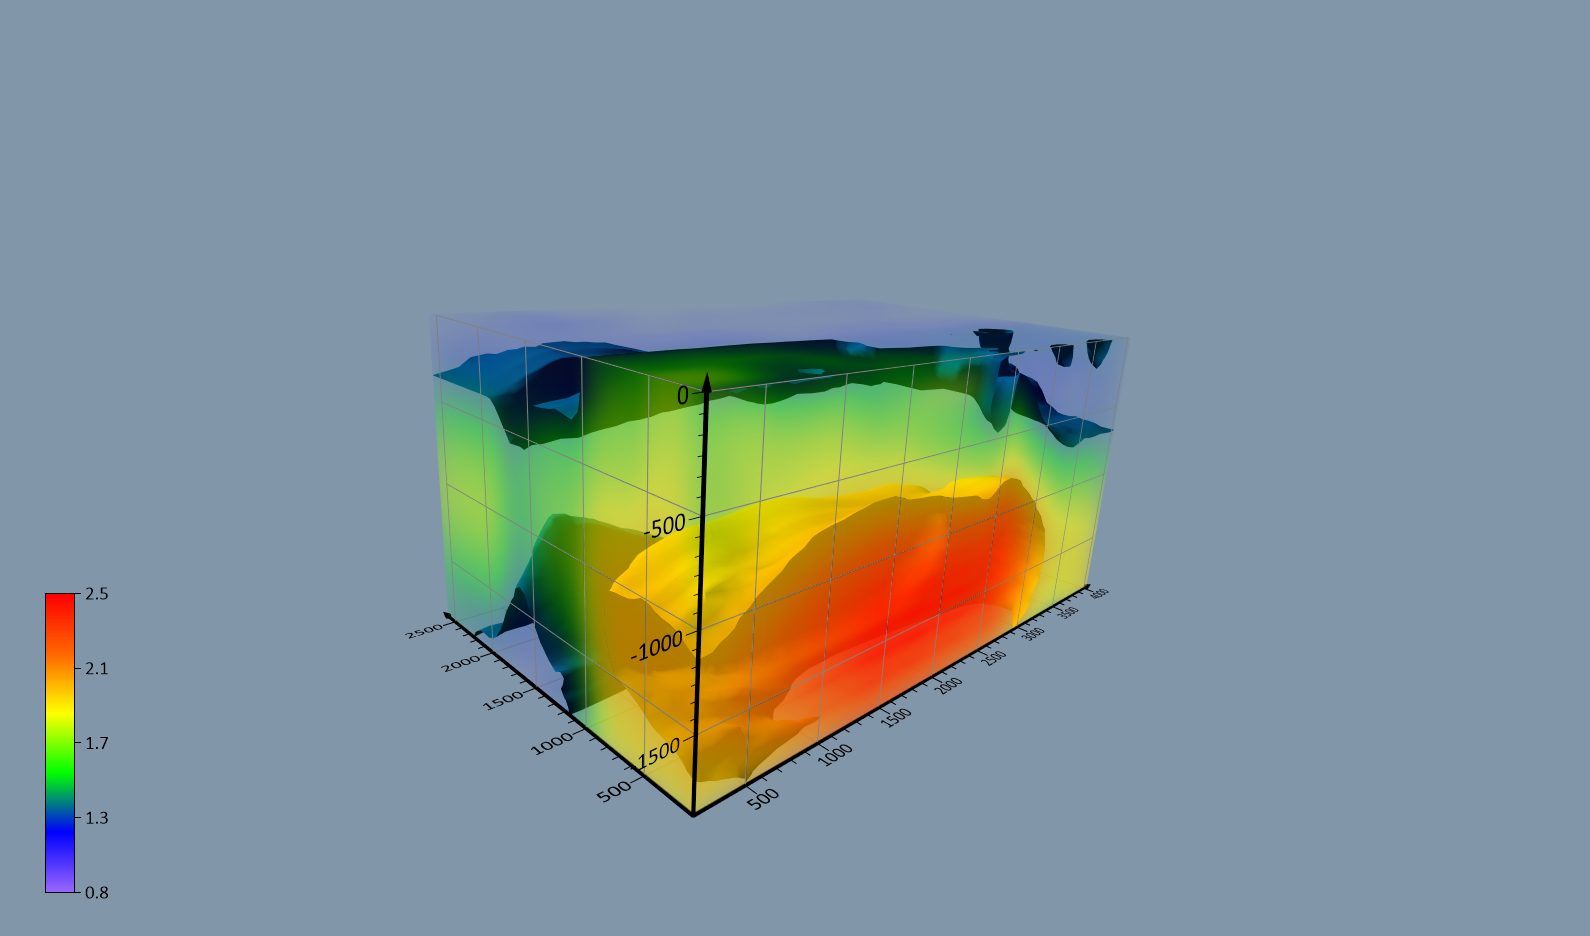
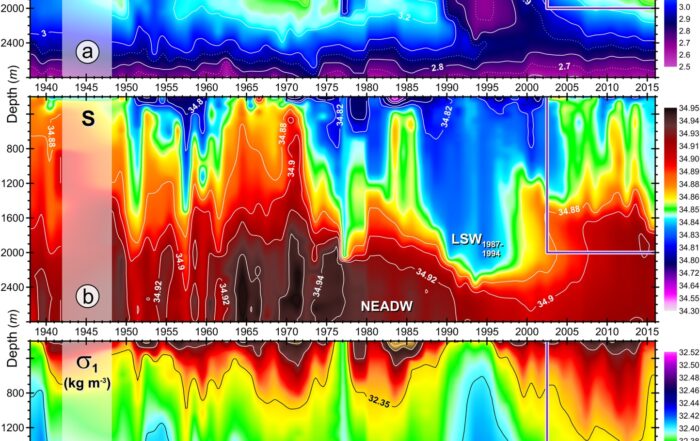
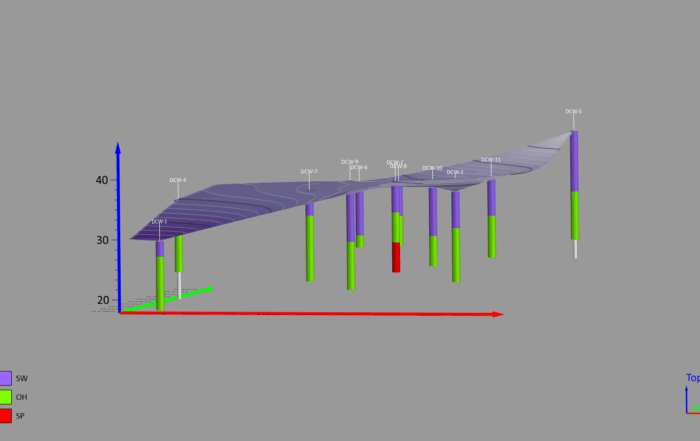
It’s easy to scroll through blogs, webinars, or success stories and become captivated by the 3D visuals on display. In each one, various elements like surfaces, legends, drillholes, aerial imagery, and more seamlessly come together into a clear, compelling, and accurate model. At some point, you’ll likely wonder: How can I create that with my own data?
Here’s the deal: re-creating a stunning 3D model you noticed online isn’t as simple as clicking a button and calling it a day. Oftentimes, this type of visualization—at least, the ones on our website—combine multiple map layers and elements to tell a complete story. So that final polished product you may be eyeing in our content? It’s rarely built from a single dataset. Instead, it’s a carefully constructed blend of data and contextual elements all working together to highlight key insights. The good news? Developing a 3D model that’s similar to the visualization that inspired you isn’t out of reach. It’s completely achievable with the right steps.
How to Create the 3D Model that Inspires You
If you’re looking to design a 3D model similar to one you’ve admired, there’s a clear path to get there. While the exact steps can vary depending on the model you’re eyeing and the software you’re using, we’ll keep things straightforward by focusing on the 3D models you may have seen on our website and explain how to re-create them in Surfer. With that said, here are the steps you should take.
1. Identify the Layers You’ll Need
Start by analyzing the model that inspired you. What layers are present? For example, do you see 2D grid-based layers like contour, color relief, and vector layers? Or, does the model include 3D grid-based layers or a drillhole layer? Identifying the necessary layers will help you determine what your model needs. It’ll also ensure you’re prepared to add the same level of detail to your visualization. For instance, if the 3D model you admire features a volume render or image slices, you’ll need a 3D grid-based layer to include those elements later on.
2. Develop Each Layer in 2D
Once you’ve identified the layers you’ll need for your 3D model, the next step is to develop each layer in Surfer. While this may sound straightforward, it’s a two-part process that requires some attention to detail:
- Ensure you have the data to create each layer: To build any layer, you need a minimum amount of data. For instance, 2D grid-based layers require at least XYZ numeric data. Conversely, if you’re working with 3D grid-based layers, you’ll need XYZC data. These are just two examples, but they highlight an essential point: every type of layer relies on specific data inputs to come to life. If you don’t have the data required for a particular layer, you can see if it’s available through your country, state, city, or county government databases.
- Format your data properly to create each layer: Having the data is one thing, but formatting it correctly is equally critical. For example, let’s say you want to make a 3D contour grid layer. The XYZC data must be neatly organized into four distinct, delimited columns to generate the layer you’re after. The same rule applies for other layers—no matter how much data you have, incorrect formatting will prevent you from getting the results you want.
After you’ve gathered and formatted the necessary data for each layer, the rest is simple. Import your data files one-by-one into Surfer to generate each layer for your model. Just remember: even though you’re working toward a 3D visualization, the process will begin in 2D. All the layers you create will initially appear in 2D, so think of this step as laying the groundwork for your final, dynamic 3D model.
3. Build On Your Visualization
Now it’s time to build on your visualization. Did the model that inspired you include legends, aerial imagery, or specific colors to highlight key details? Add those elements here to enhance your model’s storytelling power. Likewise, if the 3D model had volume renders, isosurfaces, or image slices, this is the phase where you integrate those components assuming you’ve already built the 3D grid-based layer needed to seamlessly add these elements.
4. View and Save Your Model in 3D
Once you’ve developed your model layer by layer and built upon the visualization, the next step is to switch to a 3D model. This should be as satisfying as it is simple. That’s at least the case when it comes to Surfer—transforming a model from 2D to 3D is incredibly straightforward. For example, in Surfer all you have to do is select your map in the Contents window, right-click on a layer, and select “3D View.” Then, voilà! Your model will come to life, looking every bit as impressive as the one that inspired you. If you’re happy with the result of your visualization, save your model so you can revisit it later to make any updates. Need to share it? Export it as a 3D PDF, VRML, PNG, TIF, or any format that works for your audience.
5. Reach Out for Help
Is your 3D model not quite there yet? If you’re re-creating a visualization you saw on our website and need extra guidance, our customer success team can help. All you have to do is share these three things: your data, the visualization you’re trying to replicate, and your progress so far. Then, our experts will pinpoint what’s missing and guide you through the remaining steps to perfect your model.
Tips for Presenting Your 3D Models Effectively to Stakeholders
Now that you’ve created a stunning 3D model, the next step is making sure it impresses your stakeholders. A well-designed visualization is only as impactful as its presentation, so how you showcase your work matters. Whether you’re explaining key findings, highlighting critical insights, or simply walking your audience through the data, these three tips will help you present your 3D model in a way that’s clear, engaging, and memorable.
1. Do a Live Demonstration
There’s no better way to present your 3D model than with a live demonstration. Whether you’re screen-sharing in a Zoom meeting or projecting your model onto a big screen during an in-person presentation, walking stakeholders through your visualization in real time equips you to showcase its full potential. For example, you can navigate the 3D View, zoom in on key features, and provide context as you go—all while answering questions on the spot. Live demonstrations make your presentation interactive and ensure stakeholders see your insights the way you intended.
2. Record Your Presentation
When a live demonstration isn’t possible, the next best option is to record your presentation. This option is easy to implement. You can just use third-party screen recording software to capture yourself navigating through your 3D model. Various screen recording tools like Zoom and Loom’s recording feature can help you create a polished video showcasing your visualization. Then, once you’ve saved the recording, you can share it with stakeholders, ensuring they have a clear, step-by-step walkthrough of your work to reference at any time. This approach is perfect for audiences who can’t attend live or for sending follow-up materials after your presentation.
3. Provide an Interactive Format
If your stakeholders need hands-on access to your model, exporting it as a 3D PDF or VRML file is a fantastic option. A 3D PDF is particularly versatile—it can be opened in Adobe Reader, where viewers can rotate, zoom, and interact with the model directly. They can even turn specific layers on and off to explore different aspects of the data on their own. This level of interactivity ensures that your audience fully engages with your visualization and grasps the insights you’re communicating. So whether you’re sending the file in advance or using it as part of your presentation, exporting your 3D model as a 3D PDF or VRML will give stakeholders the flexibility to explore the data at their own pace.
Create and Share Your Masterpiece
Creating a stunning 3D model that mirrors one you noticed online may seem like a challenge at first, but with the right steps and best practices, it’s well within reach. By identifying the layers you need, building your visualization layer by layer, and enhancing it with thoughtful details, you can re-create the model that first inspired you (at least, if you’re looking at ones on our website). And once your masterpiece is complete, presenting it effectively will ensure stakeholders fully understand its value—whether you’re walking them through a live demonstration, sharing a polished recording, or letting them explore an interactive 3D PDF.
Ready to bring your data to life in a 3D model you and stakeholders admire? Download a 14-day free trial of Surfer and start creating clear, compelling, and eye-catching 3D models that captivate and inform! If you need help along the way, don’t forget: our customer success team can guide you in building the visualization you’re aiming for, so reach out for assistance!
