Reveal Subsurface Contamination On-Site with Surfer
In today’s fast-paced world where clients expected results yesterday, being able to instantly transform data into figures while on-site can drastically set you apart from the competition.
One geophysical survey firm is using Surfer to map the results of its projects within minutes of collecting the raw data. Cascade Imaging Solution’s technicians are able to access Surfer from the field and conduct initial data interpretation to generate georeferenced PDF maps that are accessible to stakeholders. Ensuring their clients walk away from the project site impressed, and with an understanding of what is going on beneath their feet.
“We do mapping on a laptop right in our truck,” said Brandon White, President of Cascade Imaging Solutions Inc. “The clients want the results right away, and we need to know we’ve surveyed the entire area.”
Based in Edmonton, Alberta, the geophysical firm uses frequency domain electromagnetic devices to measure the conductivity of the Earth. Specifically, they are looking for ionic compounds, such as salts, that indicate underground contamination from oil & gas, agriculture, and road maintenance operations.
High conductivity measurements correspond with abnormally high concentrations of subsurface salts, possibly related to leaks or spills of petroleum emulsions, fertilizers, livestock waste or road deicing chemicals.
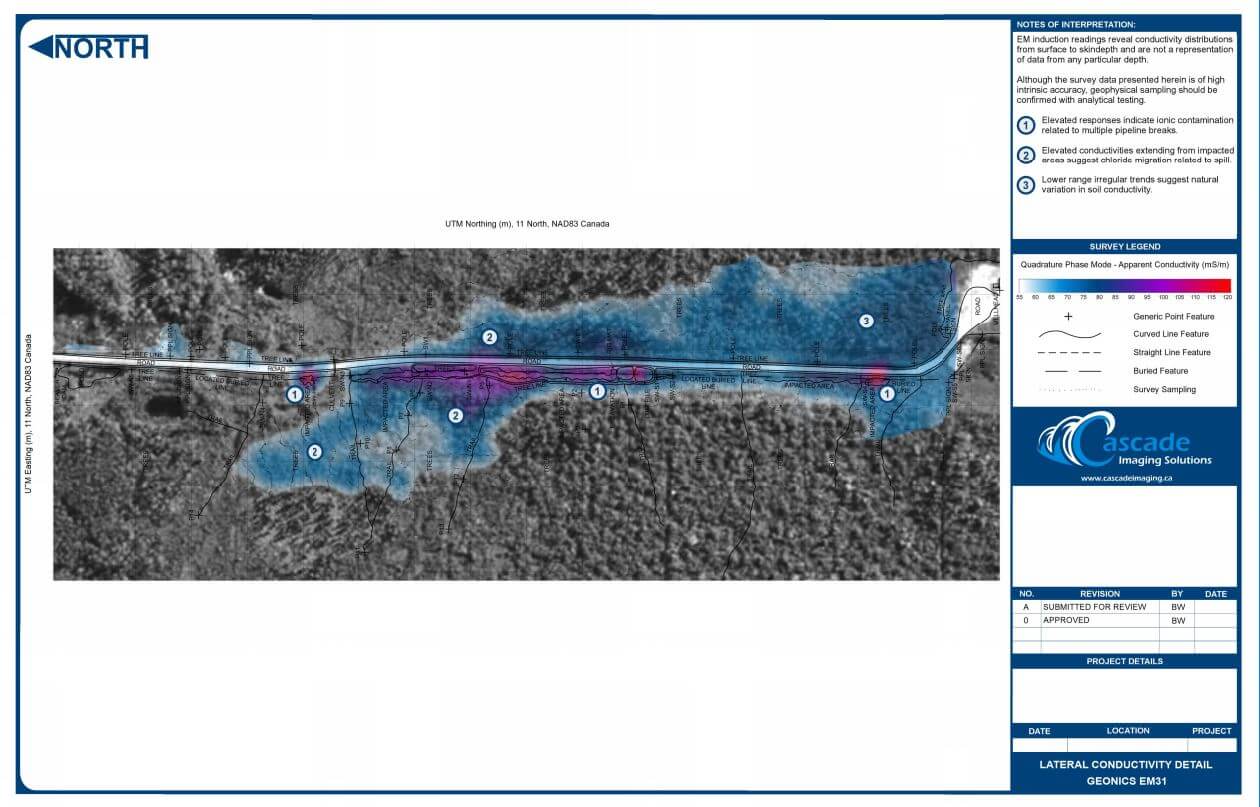
“We use Surfer to image the data, producing a color contour map showing where the contamination is,” said White. “It’s usually a color-scale heat map [where] red means higher conductivity, or contamination.”
Soil conductivity is measured in milli-siemens, but the scale is not absolute. Every site has some natural conductivity based on its physical and chemical properties. This means Cascade Imaging technicians must first examine the raw data in Surfer to determine the natural conductivity level of the area. Once this is determined, they can establish a relative conductivity scale in Surfer and generate the contour map showing locations of anomalies.
The results could be mapped with GIS software, White said, but the expensive package he tested was too cumbersome to use, with too many steps for importing and exporting of data. The results weren’t as visually impressive as those generated in Surfer either. He added that it’s also quick and easy to teach new technicians how to use Surfer.
An enormous advantage for Cascade Imaging is Surfer’s ability to handle and output georeferenced data. The conductivity measuring devices used by the Edmonton firm are linked to a GPS which tags each point with x, y and z coordinates. Once the contour maps have been made, Surfer retains the georeferencing and outputs the results in geo-PDF format.
“We can email the PDF right to the client’s smart phone [onsite] so they can figure out where the contamination is relative to where they are standing,” said White.
Back at the office, Cascade technicians massage the data in Surfer to generate high-quality contour maps as final deliverables to the client. Often, the contour map is overlaid on a digital elevation layer or air photo to provide additional perspective. Once the contamination map is completed and delivered, the client typically uses the information to drill into the site to confirm the presence, concentration and depth of the pollutant
Golden Guarantee
100% Satisfaction Guaranteed or 100% of Your Money Back
We know Surfer and Grapher’s visualization capabilities will help you stand out from the crowd, WOW clients, and leave a lasting impression!
But… we realize you don’t know this yet. And you won’t until you experience our products for yourself.
This is why we provide this guarantee. This is the distillation of a 40+ year adventure designing, developing, and honing powerful visualization and analysis features as requested by scientists and engineers like you.
Our products can produce results far beyond its license fees. We are assuming all your risk, so you have none.


