Geologists Determines Optimal Waste Disposal Location
A Nigerian geological and geophysical services company used Surfer to create a breakthrough ground water flow map for an area in the southeastern part of Nigeria, Africa. The company, Geovinda Services of Owerri, Nigeria, relied on information from the map to recommend where future waste management infrastructure should be located to avoid contaminating the local fresh water aquifer.
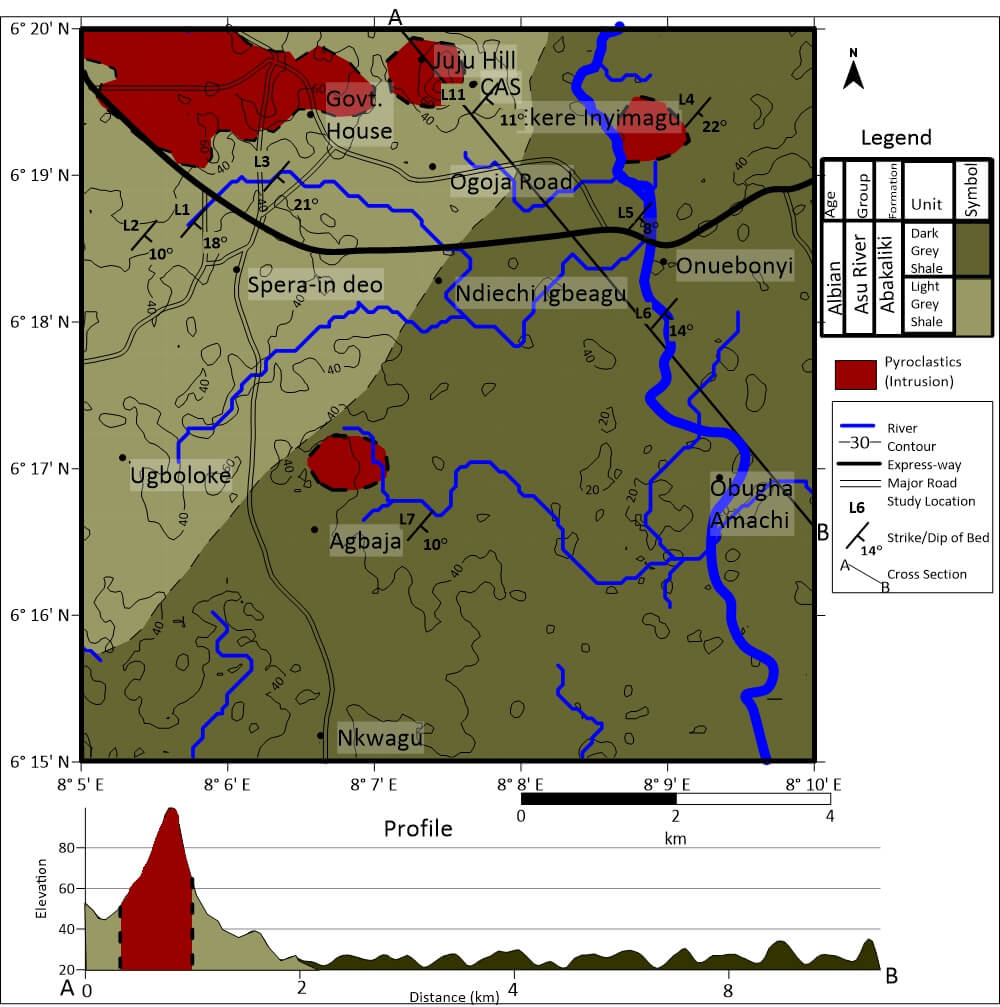
Gibson Okeke, a geologist with Geovinda, sought to map surface and ground water flow in the urban region of Nigeria known as Abakaliki. There was concern that contaminants could already be reaching the water table and proposed waste disposal plans could make the situation worse. Mining was already active in the area, and a waste dumpsite had been located in an abandoned quarry. The Ebonyi River flows through the study area, which receives heavy tropical rains.
Gibson Okeke obtained a variety of data sets, including borehole analyses and field mapping, to unravel the subsurface geology. More than 100 hand-dug wells revealed the top of the water table varied from 20 to 45 meters deep. Gibson Okeke accessed digital base maps directly in Surfer to begin compiling his geologic and hydrogeologic data sets.
His research focused on the lithology of the underlying bedrock and the density of lineaments in the area. Lineaments are surface expressions of subsurface features, usually underground faults, that can serve as conduits for surface water to flow into the water table. Gibson Okeke mapped the borehole profiles, which revealed the geology, and created the surface lineaments in Surfer. He visualized the strata and fault lines with the software to determine the direction of bedrock slope and the dominant direction of the lineaments.
“[The visualization showed] areas with high lineament density represent high surface-recharge zones, while areas with low lineament density represent low surface-recharge zones,” Gibson Okeke said.
Gibson Okeke performed additional visualization of the recharge zones and the aquifer in Surfer. He concluded the alignment of dominant lineaments and subsurface bedding slopes was causing ground water to flow from the recharge areas in the northwest portion of the study area to the aquifer discharge site to the southeast.
“This is very important in ground water exploration, waste management, and contaminant transport,” said Gibson Okeke.
Waste Disposal Recommendations:
Based on his Surfer visualizations, he made several recommendations:
- Existing mining operations in the northwest part of the study area – the recharge zone – should be reduced to minimize harmful chemicals penetrating the water table.
- The existing dumpsite also located in the recharge zone should be shut down immediately.
- All future dumpsites should be located to the south of the discharge zone to prevent contaminants flowing into the aquifer.
- Potable water wells should be dug in the northwest or northeast part of the aquifer where water is plentiful but contamination is less likely to have occurred.
“The fast gridding in Surfer was so helpful in creating my model…and displaying a smooth model surface in 2D and 3D,” said Okeke.
Golden Guarantee
100% Satisfaction Guaranteed or 100% of Your Money Back
We know Surfer and Grapher’s visualization capabilities will help you stand out from the crowd, WOW clients, and leave a lasting impression!
But… we realize you don’t know this yet. And you won’t until you experience our products for yourself.
This is why we provide this guarantee. This is the distillation of a 40+ year adventure designing, developing, and honing powerful visualization and analysis features as requested by scientists and engineers like you.
Our products can produce results far beyond its license fees. We are assuming all your risk, so you have none.


