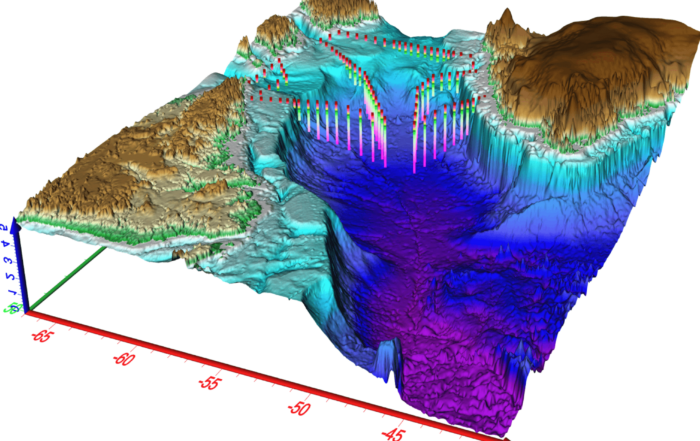
Gabbie Rhodes2025-08-18T13:36:22-06:00How Do You Combine Different 2D and 3D Data Types Into One Model?Gabbie Rhodes2025-08-18T13:36:22-06:00
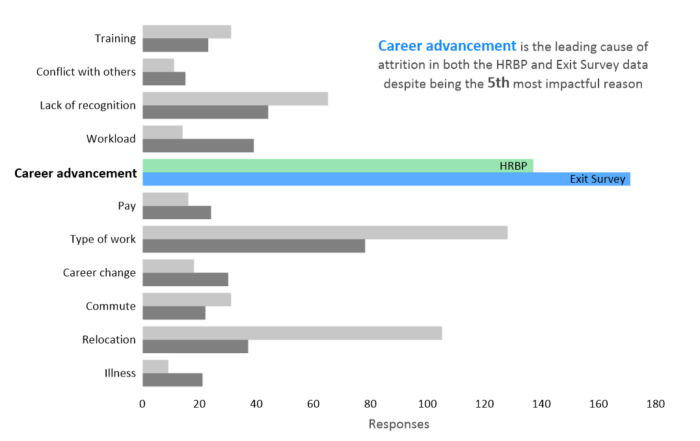
Gabbie Rhodes2026-03-12T20:55:18-06:00Designing Cool Data Visualizations: How to Engage and Inspire StakeholdersGabbie Rhodes2026-03-12T20:55:18-06:00
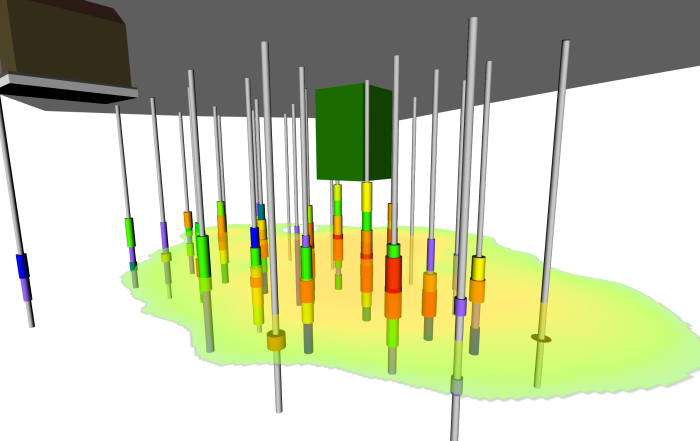
Drew Dudley2025-08-18T13:38:39-06:00Best Practices for Gridding Drillhole DataDrew Dudley2025-08-18T13:38:39-06:00