When to Use (and Not Use) Topographic 3D Maps to Relay Data-Driven Insights
When working on complex projects, you need to turn data into meaningful insights that people can actually understand. One of the best ways to do that? Topographic 3D maps. These visualizations bring Earth’s features to life, helping stakeholders grasp what’s happening on the surface. They also give perspective on what’s occurring underground (if you have a topographic surface and subsurface data to visualize). But do these maps work for every data-driven story? Let’s find out.
Real-World Applications for Topographic 3D Maps
Topographic 3D maps can be a total game-changer in a variety of scenarios. To prove the point, let’s dive into three real-world examples where these maps transformed complex data into compelling visuals, delivering crystal-clear insights to stakeholders.
1. Revealing Mineralization Zones
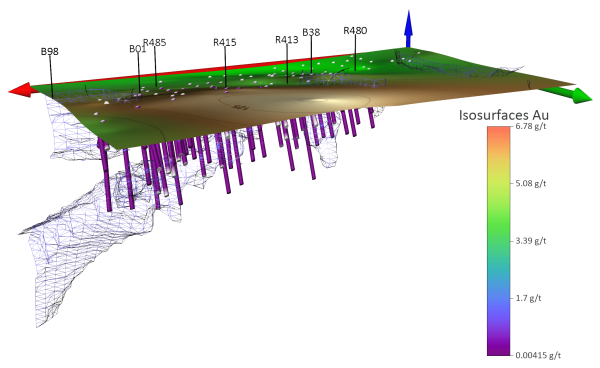
When it comes to understanding what’s happening underground, topographic 3D maps with subsurface data can provide the right perspective. Just ask Canadian Geoconsultant Ricardo Valls, who relies on Surfer to create detailed 3D visualizations that give his mining clients a clear picture of the surface and subsurface. Using these maps, Valls confidently tells his clients where they should drill—and, just as importantly, where they shouldn’t.
His confidence comes from the fact that his 3D maps have both a topographic surface and subsurface visualization to reveal key mineralization zones, essentially providing a path for drilling success. The result? Informed decisions and significant cost savings for his clients.
On some exploration projects, core holes can reach depths of 1,000 meters, with each meter costing around $200. By simplifying complex data into 3D maps that illustrate an area’s topography and what’s happening directly underneath, Valls helps his mining clients zero in on promising deposits and avoid drilling unnecessary holes—saving them millions in the process.
2. Showcasing Changes to Water Resources
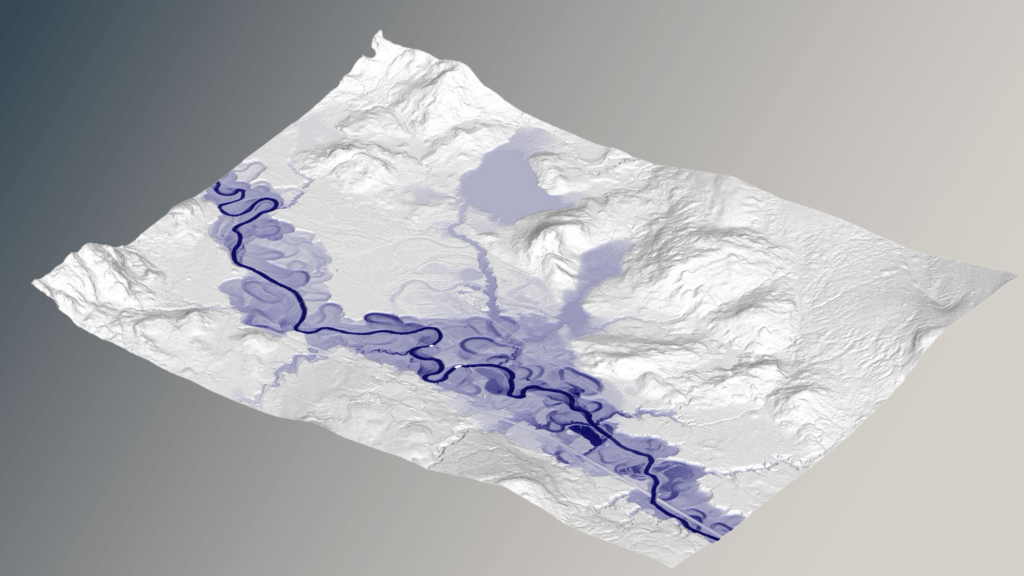
The Baker River in New England flows through some of the most picturesque landscapes in the region, but its story runs much deeper than what meets the eye. Thanks to the detailed topographic 3D maps created with Surfer, Steve Boynton, owner and operator of Subsurface Environmental Solutions, helped stakeholders visualize the river’s shifting channels, oxbow lakes, and the surrounding White Mountain foothills with remarkable precision.
These maps brought the dynamic evolution of the river to life, showcasing how natural processes have shaped the landscape over time. Oxbow lakes—those distinctive, crescent-shaped bodies of water cut off from the main river—were essential in understanding how the Baker River had changed course. To illustrate this unique feature, Boynton transformed his data into multiple visualizations, including topographic 3D maps with color relief, allowing stakeholders to analyze subtle changes in the terrain.
But it wasn’t just the river that stole the show. The maps also highlighted the dramatic White Mountain foothills, illustrating how the rugged geography influences the river’s path and the surrounding environment.
3. Highlighting Archeological Discoveries
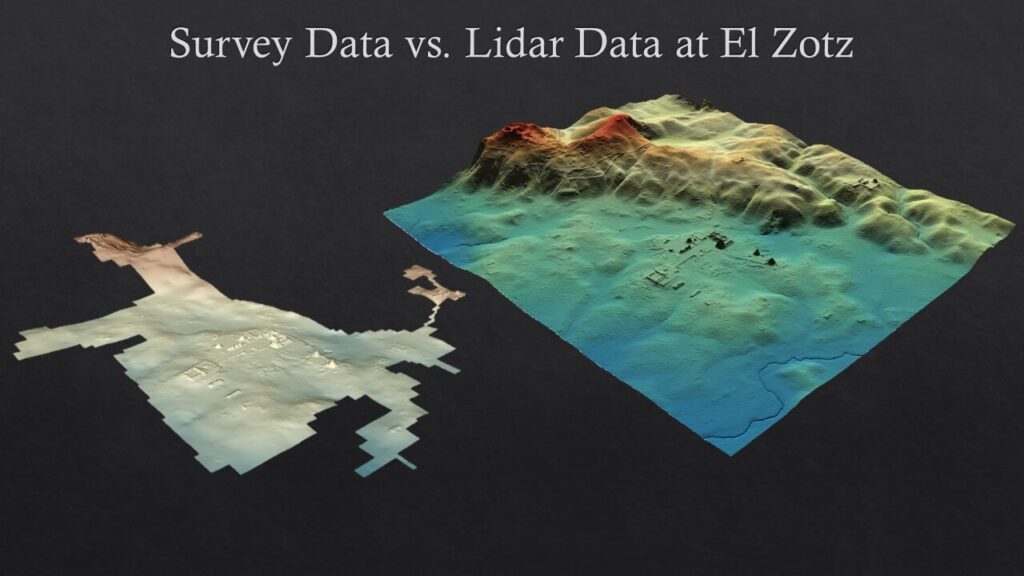
Imagine revealing to the world a lost fortress buried deep in the Guatemalan jungle. That’s exactly what archaeologists, led by Dr. Marcello Canuto, managed to do—thanks to the power of topographic 3D maps. With thick jungle growth concealing much of the ancient Maya civilization’s secrets, traditional methods of exploration just weren’t cutting it. Enter 3D topographic maps—created with LiDAR and visualized with Surfer—to reveal what was concealed beneath the thick vegetation.
These detailed 3D models helped stakeholders peer through the jungle canopy, uncovering the structure and layout of the long-forgotten fortress now known as La Cuernavilla. The high-resolution visuals offered invaluable insight into the terrain and architecture, showing walls and housing structures that would’ve been impossible to see otherwise. It was only with the clear topographic 3D maps that Dr. Canuto effectively showed the ancient fortress in a way that brought the past to life.
2D vs. 3D Topographic Maps
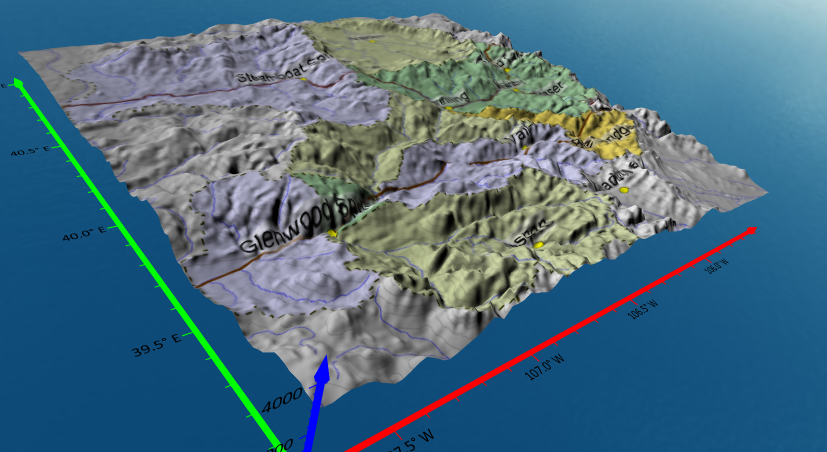
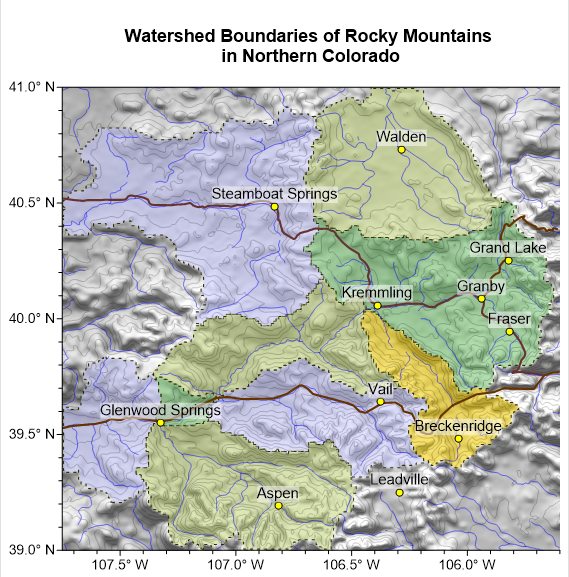
As amazing as 3D maps can be, they’re not always the right tool for every job. Sometimes, 2D topographic maps work better. Case in point: illustrating watershed boundaries in the Rocky Mountains in Northern Colorado. We created a 2D topographic map and a 3D topographic map to visualize this information. Guess which one communicated the data better? The 2D map hands down.
As you can see, the boundaries on the 2D topographic map are clear and precise—but on the 3D map, they’re almost unrecognizable. This example serves as a great reminder that, while topographic 3D maps are fantastic for various applications, sometimes a 2D map does a better job of relaying insights. So, don’t ditch your 2D visualizations anytime soon. They still deserve a spot in your toolbox.
Use Wisdom with 3D Topographic Maps
At the end of the day, topographic 3D maps can be just what you need to visualize complex data—whether you’re mapping archaeological discoveries, identifying prime drilling spots, or tracking changes in water resources. But they’re not always the hero of every story. Next time you’re trying to visualize your data to communicate key information, consider this: use topographic 3D maps wisely. When they fit the bill, they’ll transform your data into clear, compelling insights.
Curious if a 3D topographic map will help inform stakeholders? Download a 14-day free trial of Surfer to explore your data like never before.
